


At the end of the week NZDUSD remains near the highs of the right hand shoulder in the possible head and shoulders pattern we identified a few days ago. We remain bearish as long as price is below the key resistance at 0.67.
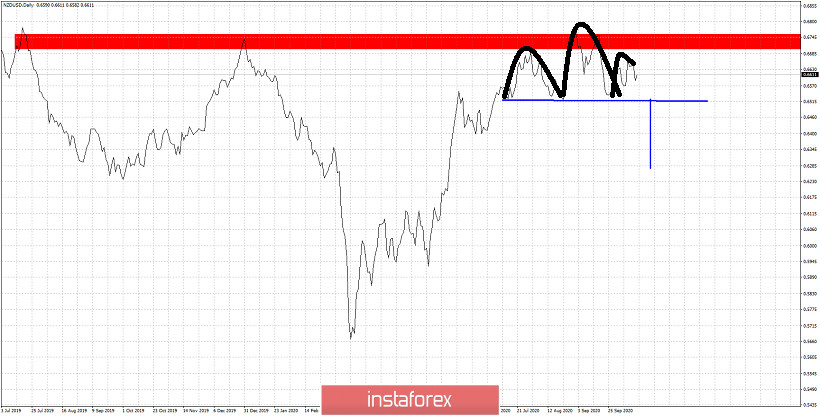
Horizontal Blue line -neckline support
Black lines - head and shoulders pattern
Blue vertical line -target size of drop if pattern activated
The chances of this pattern playing out are high. However as we previously said, this bearish pattern is only activated once price breaks below the horizontal support trend line. So bears need to break below 0.65. As long as price remains above 0.65 bulls have hopes of challenging the 0.68-0.69 area.


