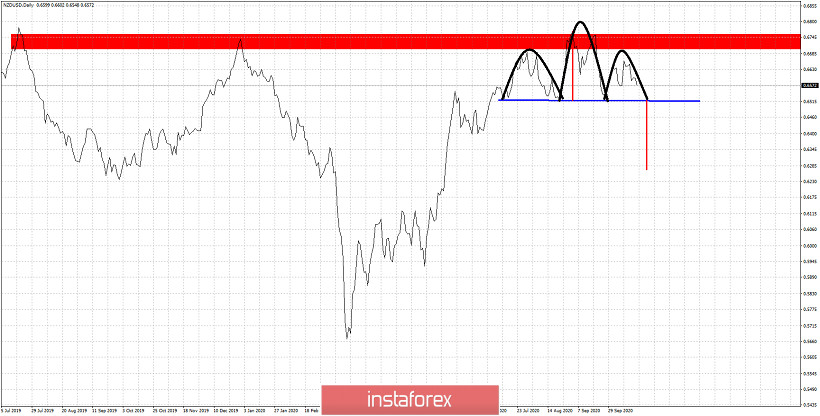
As we have explained in previous analysis, NZDUSD could very possibly be forming a head and shoulders pattern with the neckline at 0.6520 and the target at 0.63 if the pattern is activated. Today price is pushing lower towards the short-term support of 0.6570. Breaking below this level will increase chances of testing and breaking below 0.6520.

Blue line- neckline support
Black lines - head and shoulders pattern
Red line -size of decline if head and shoulders pattern activated
NZDUSD is still above the neckline support. Bears need to break below this support blue line in order for the selling pressures to rise and a move towards 0.63 to start. Price is below key resistance at 0.67. The scenario that this is a topping formation are high. Confirmation of this bearish idea will come with the break below 0.65.


