


An analysis of the large scale of the schedule of the main pair of European currencies shows the formation in the last 2 years of the correctional model of the "ascending stretched plane". The proportions of all parts of the wave are met and the minimum lifting targets are achieved. The signals of a turn on the chart are not observed, which is an indirect signal for the continuation of the upward trend of the pair that continues throughout the current year.
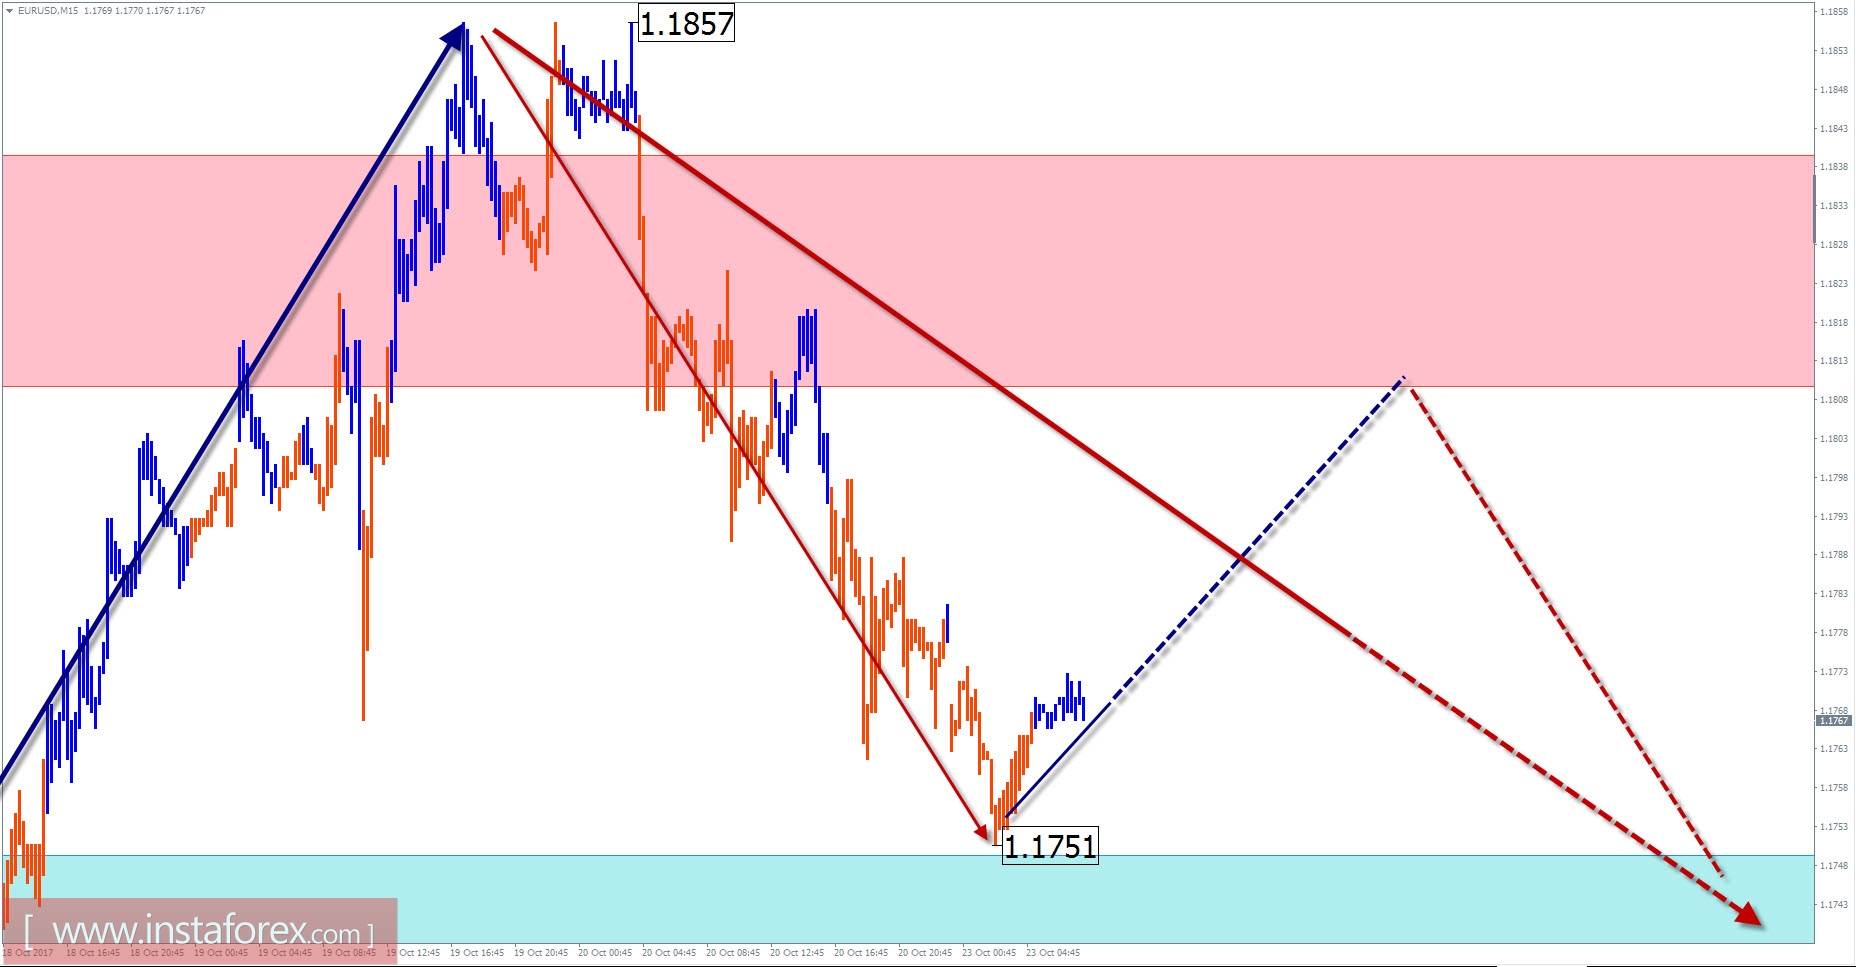
On a smaller time scale, a downward wave section is tracked from the end of summer. The middle part of the structure is nearing its completion.
In the past 2 weeks, the current wave has become more complicated with the formation of a blank for the flat horizontal triangle on the graph.
Today, there is a high probability of an ascending part of the traffic. Before the beginning of the growth phase, the short-term pressure on the support zone is not ruled out.
The boundaries of the resistance zones:
- 1.1810 / 40
The boundaries of the support zones:
- 1.1750 / 20
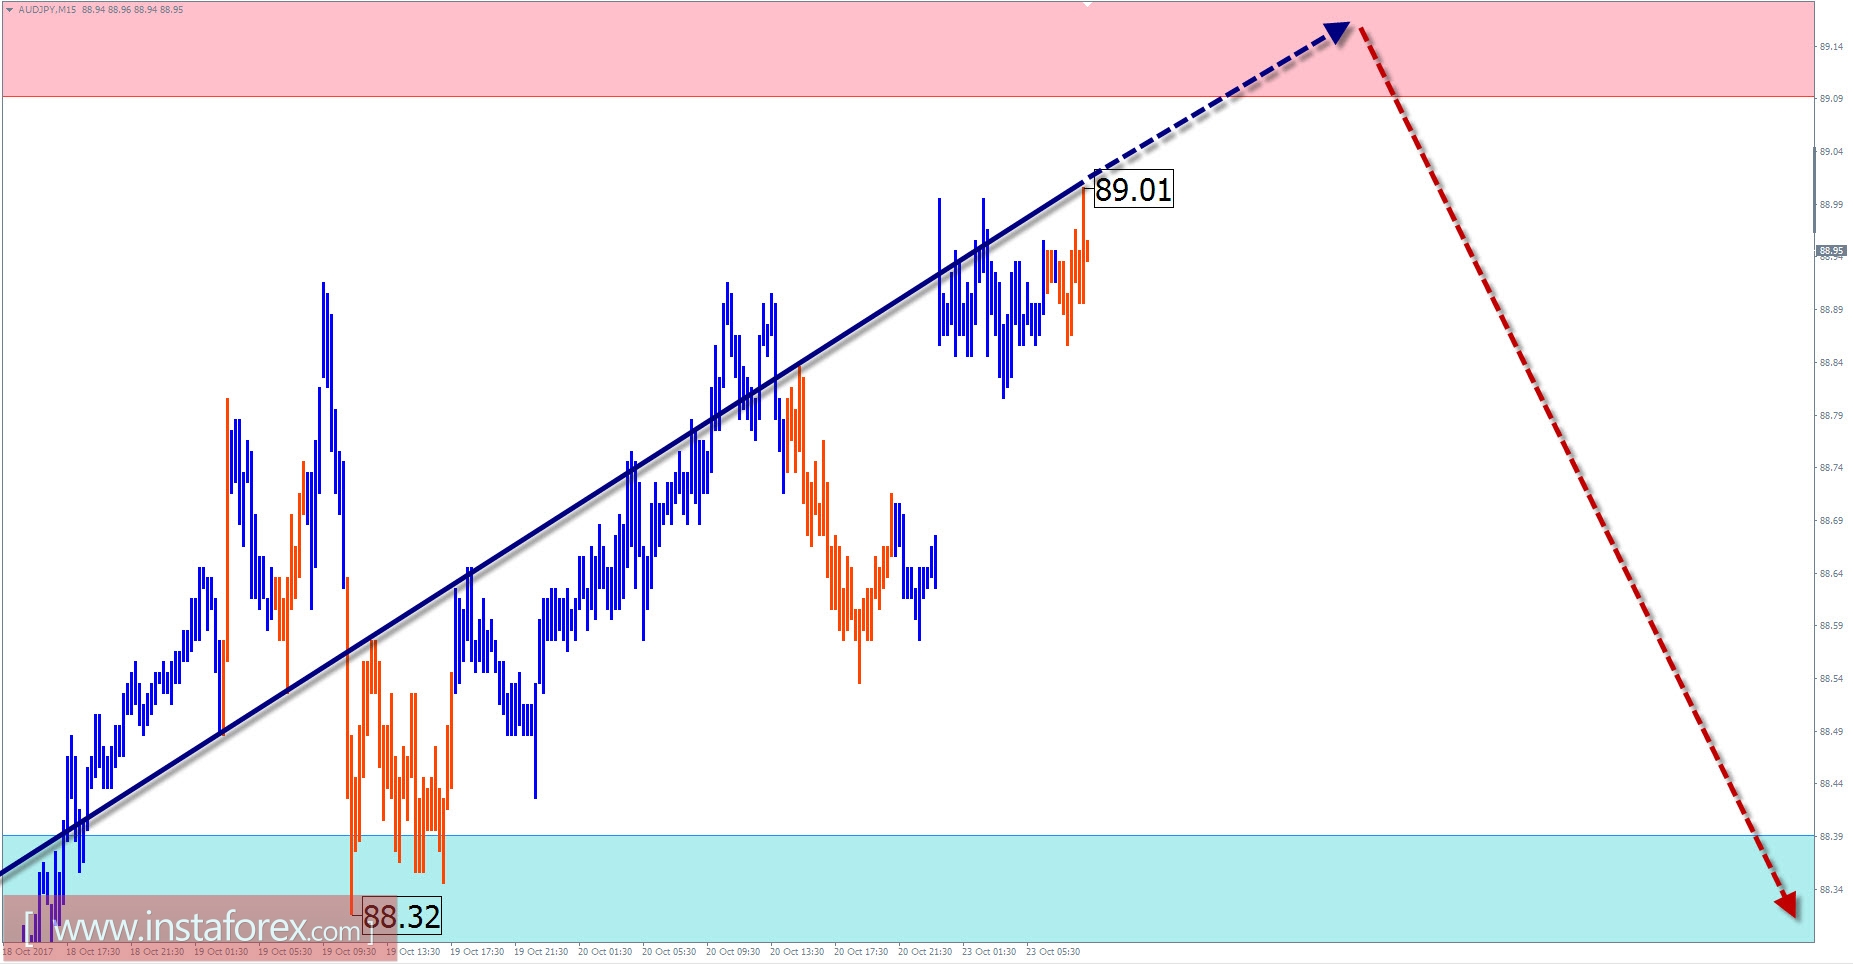
Overview of AUD / JPY with a forecast for the current day
The uptrend moves the price of the cross-currency pair Australian Dollar / Yen since June last year. In September, the pair's quotes reached the lower boundary of the large-scale potential turn area. The analysis of the structure of the wave shows its completeness. At the present time, there are no overlapping structures on the chart, capable of giving rise to a descending wave of a similar scale.
Today, the wave construction in the short-term time scale started on September 21. In its structure, the first part of the wave (A) is formed. The average, correcting part of the wave is close to completion.
Today, you can count on the completion of the current and the beginning of the oncoming phases of the movement. The resistance zone indicates the most likely area for changing trends. The price move down is more likely in the afternoon.
The boundaries of the resistance zones:
- 89.10 / 40
The boundaries of the support zones:
- 88.40 / 10
Explanations to the figures: For simplified wave analysis, a simple waveform is used that combines 3 parts (A; B; C). Of these waves, all kinds of correction are composed and most of the impulses. On each considered time frame the last, incomplete wave is analyzed.
The areas marked on the graphs are indicated by the calculation areas in which the probability of a change in the direction of motion is significantly increased. Arrows indicate the wave counting according to the technique used by the author. The solid background of the arrows indicates the structure formed, the dotted one indicates the expected wave motion.
Attention: The wave algorithm does not take into account the duration of the tool movements in time. The forecast is not a trading signal! To conduct a trade transaction, you need to confirm the signals of your trading systems.


