


GBP / JPY pair
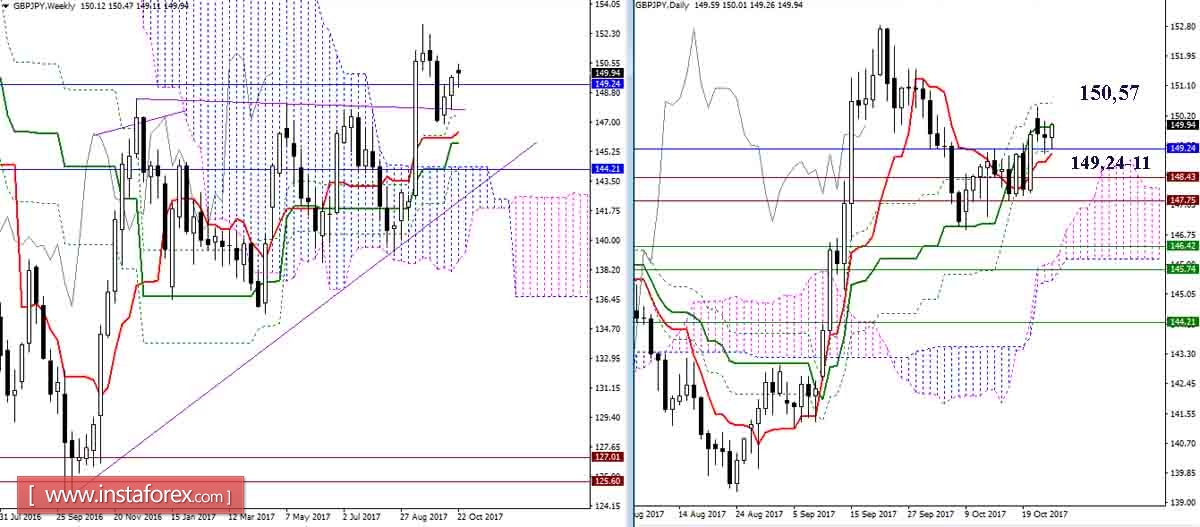
The pair maintains its position above the support levels in the monthly Fibo Kijun (149.24) and the day Tenkan (149.11). The power of the support levels can trigger a new stage of recovery. The most important resistance, which is in this case, it is the breakdown of the daytime Fibo Kijun (150.57). Fixing below the support area can delay the development of bullish plans and contribute to the return of bearish sentiment.
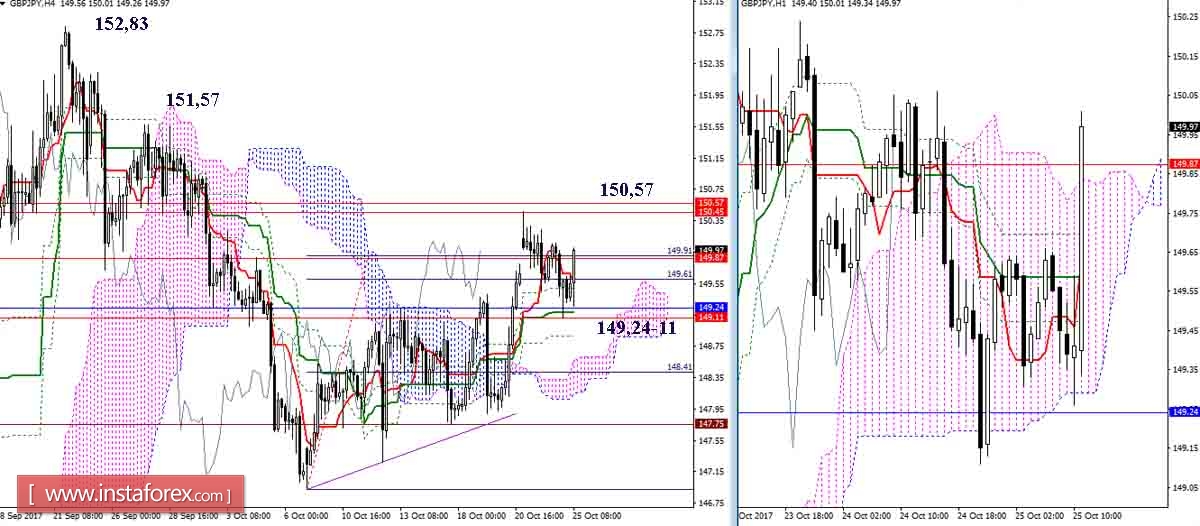
Players on the rise retain certain advantages. Overcoming the resistance (150.57) opens opportunities for testing the maximum boundaries between 151.57 - 152.83, in order to restore the rising trend of the older time frames. The breakdown of key supports in the area of 149.24 - 11, where several levels of junior and senior time intervals are combined at once, will allow the change of the existing balance of forces. At the same time, this forms the first downside target (the goal for the breakdown of the H1 cloud) which requires a new assessment of the situation.
EUR / JPY pair
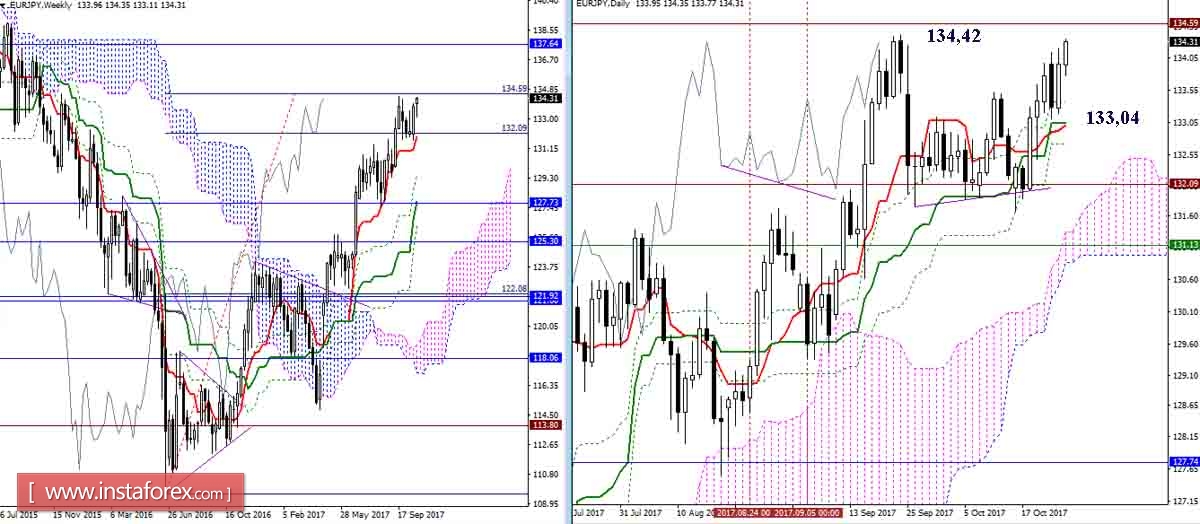
The potential of the weekly bullish candle turned out to be stronger. Therefore, the opportunities for day-time bearish tone remained unrealized. On the next day, the rivals have already updated the maximum candle model. players on the rise continue to rise at the moment, where the benchmark of the maximum boundary is found at the level of 134.42 and the 100% level of the weekly goal for the breakdown of the cloud.
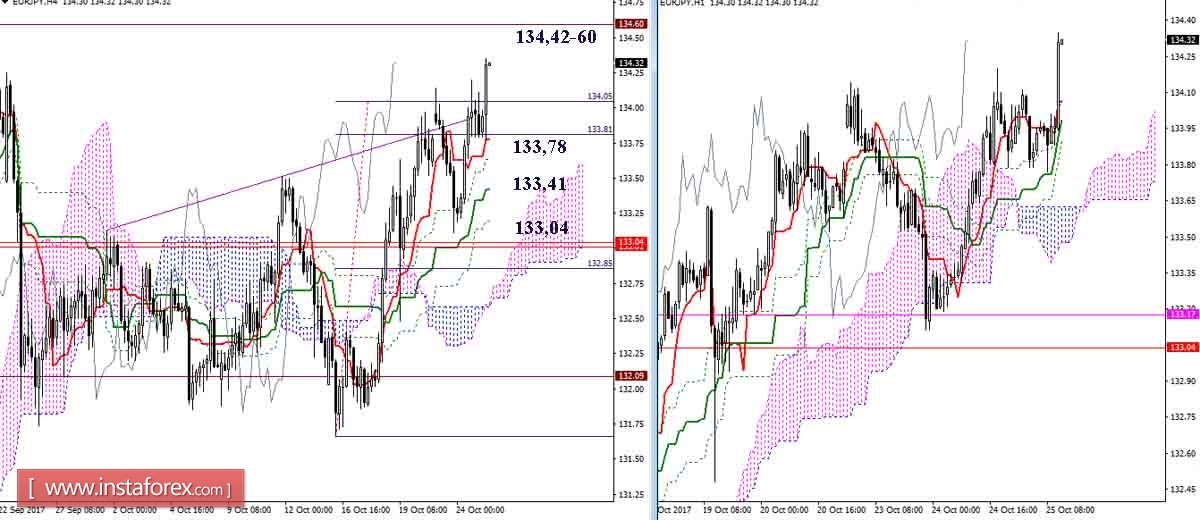
Players on the rise overcame the resistance of the spent target at 134.05 for the breakdown of the cloud H4 and continues to climb. Among the benchmarks, the area of 134.42-60 (maximum + level of 100% of the weekly goal) can be noted. However in this case, considering the nature of the movement, the task of players on the rise, it will most likely not simply achieve the resistance levels, but to break through and overcome them. Among the supports for today, these levels can be noted: 133.78 (Tenkan H4 + cloud H1) - 133.41 (Kijun H4) - 133.04 (day cross + cloud H4).
Indicator parameters:
all time intervals 9 - 26 - 52
The Color of indicator lines:
Tenkan (short-term trend) - red,
Kijun (medium-term trend) - green,
Fibo Kijun is a green dotted line,
Chikou is gray,
clouds: Senkou Span B (SSB, long-term trend) - blue,
Senkou Span A (SSA) - pink.
The Color of additional lines:
support and resistance MN - blue, W1 - green, D1 - red, H4 - pink, H1 - gray,
horizontal levels (not Ichimoku) - brown,
trend lines - purple.


