


Overview of AUD / USD with a forecast for the current day
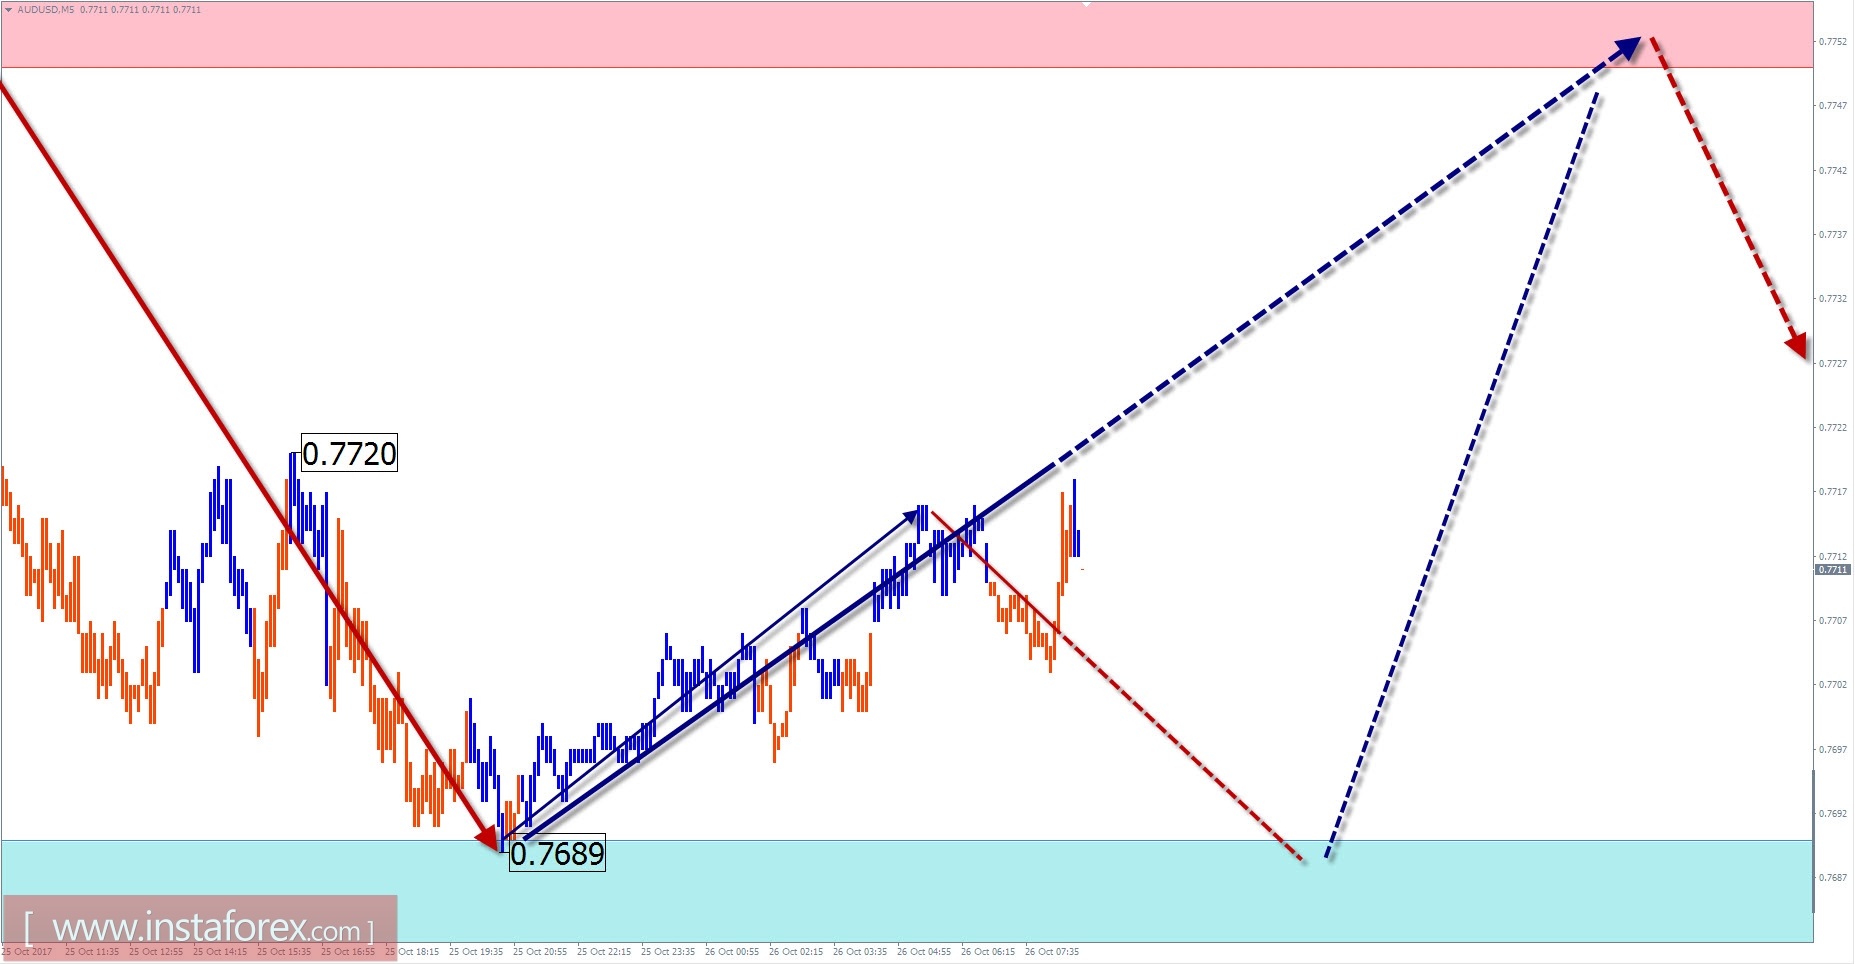
After reaching the major Australian currency's major currencies, the price of the pair moves down. The structure of the downward wave from September 8 has a pronounced zigzag. On October 13, the correction wave section was completed, giving a start to the bearish impulse. The preliminary calculation of the completion zone indicates the likely course of the price down in the area of 2 price figures from the current rate.
Yesterday, the pair moved down almost to the full figure and reached the intermediate support of a large time frame.
Today, a correction area is expected. Ascending mood is likely most of the day. At the next session, a short-term decline is not excluded. The most likely upper boundary of the day's course of the pair will be the boundaries of the resistance zone.
The boundaries of the resistance zones:
- 0.7750 / 80
The boundaries of the support zones:
- 0.7690 / 60
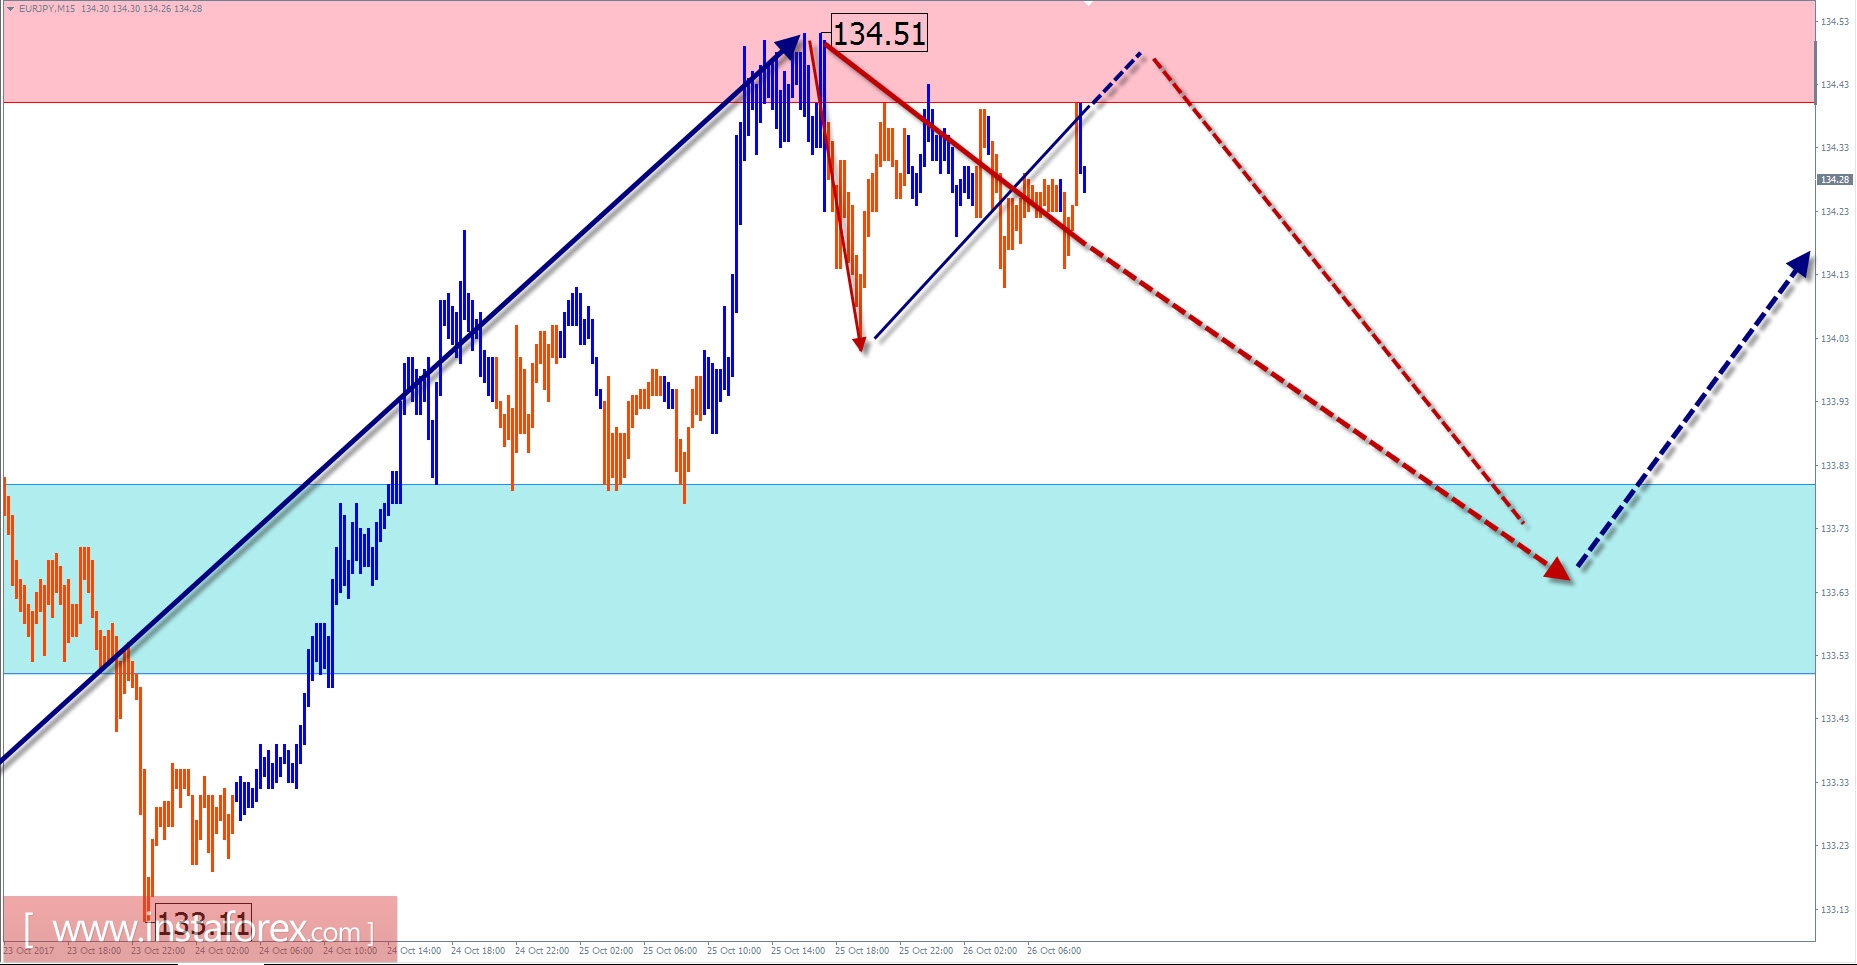
Overview of EUR / JPY with the current day forecast
The price of the cross-euro / yen pair continues the development of the rising wave algorithm, which sets the trend for the price movement since June last year. In the middle of last month, a strong resistance level was achieved at the price, which provoked the formation of a correction section in the flat. Analysis of the structure of this segment of the graph shows the absence of the final part (C). Given the impulse form of the main trend wave, the scope of the upcoming movement is unlikely to exceed the minimum required size.
Today is expected to be a common flat for the movement of the pair, with a descending vector. In the next few hours, the pressure on the resistance zone is not ruled out. The support area indicates the most expected lower bound of daily volatility.
The boundaries of the resistance zones:
- 134.40 / 70
The boundaries of the support zones:
- 133.80 / 50
Explanations to the figures: For simplified wave analysis, a simple waveform is used that combines 3 parts (A; B; C). Of these waves, all kinds of correction are composed and most of the impulses. On each considered time frame the last, incomplete wave is analyzed.
The areas marked on the graphs are indicated by the calculation areas in which the probability of a change in the direction of motion is significantly increased. Arrows indicate the wave counting according to the technique used by the author. The solid background of the arrows indicates the structure formed, the dotted one indicates the expected wave motion.
Attention: The wave algorithm does not take into account the duration of the tool movements in time. The forecast is not a trading signal! To conduct a trade transaction, you need to confirm the signals of your trading systems.


