


The review of EUR / USD pair with a forecast for the current day
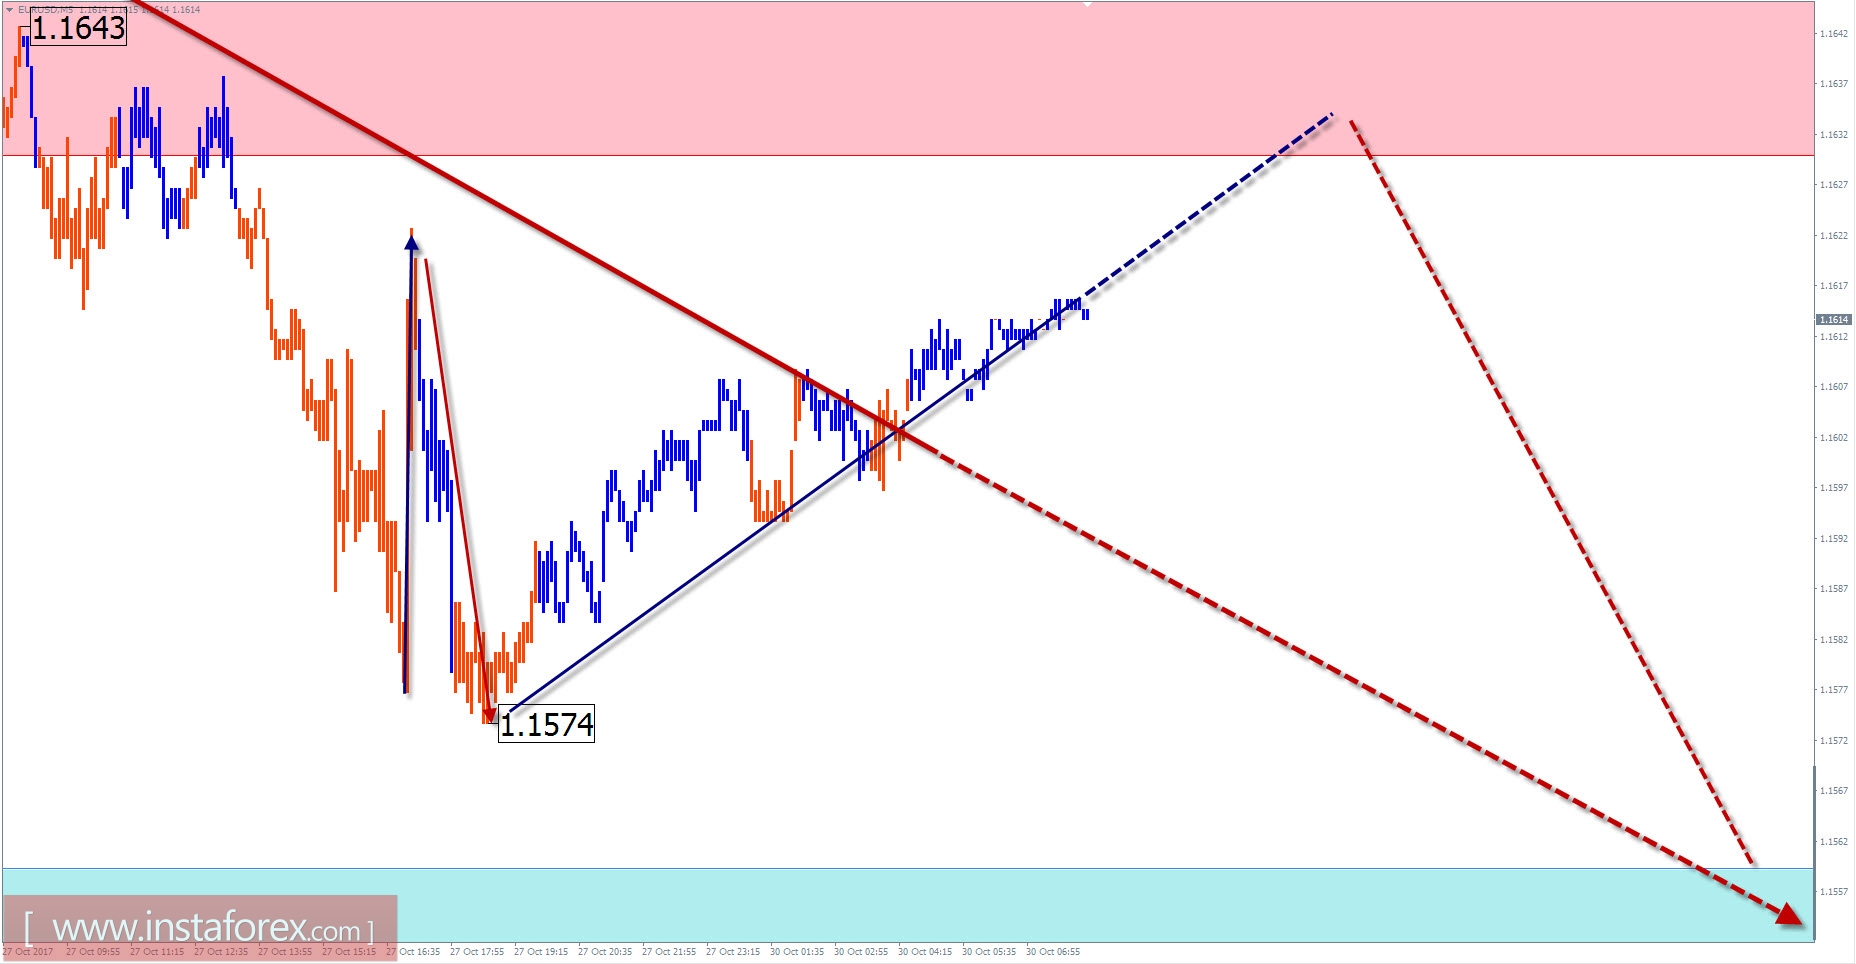
In the recent months, the price fluctuations of the major European currency pair are consistent with the algorithm of the wave that has lasted since August 29. All throughout the descending structure was formed in the zone of potential reversal at the end of the main trend wave. On October 19, the corrective phase of the movement was completed and the final stage of the wave started. The reason for the beginning of the price decline was the publication of the decisions at the next meeting of the ECB. At the time of analysis, the quotes of the pair reached a minimum level of extension, which is already sufficient to complete the downward correction. Nevertheless, the generated reversal signals on the chart have not yet been observed. The preliminary calculation allows the assumption of a high probability of the continuation of the downtrend by at least 2 more price figures.
Today, the overall lateral attitude of the pair's oscillations is expected. At the next session, the price can reach the boundaries of the resistance zone. In the afternoon, the probability of a turn and a return to the local low of last week is high.
Boundaries of resistance zones:
- 1.1630 / 60
Boundaries of support zones:
- 1.1560 / 30
Overview of USD / JPY pair with a forecast for the current day
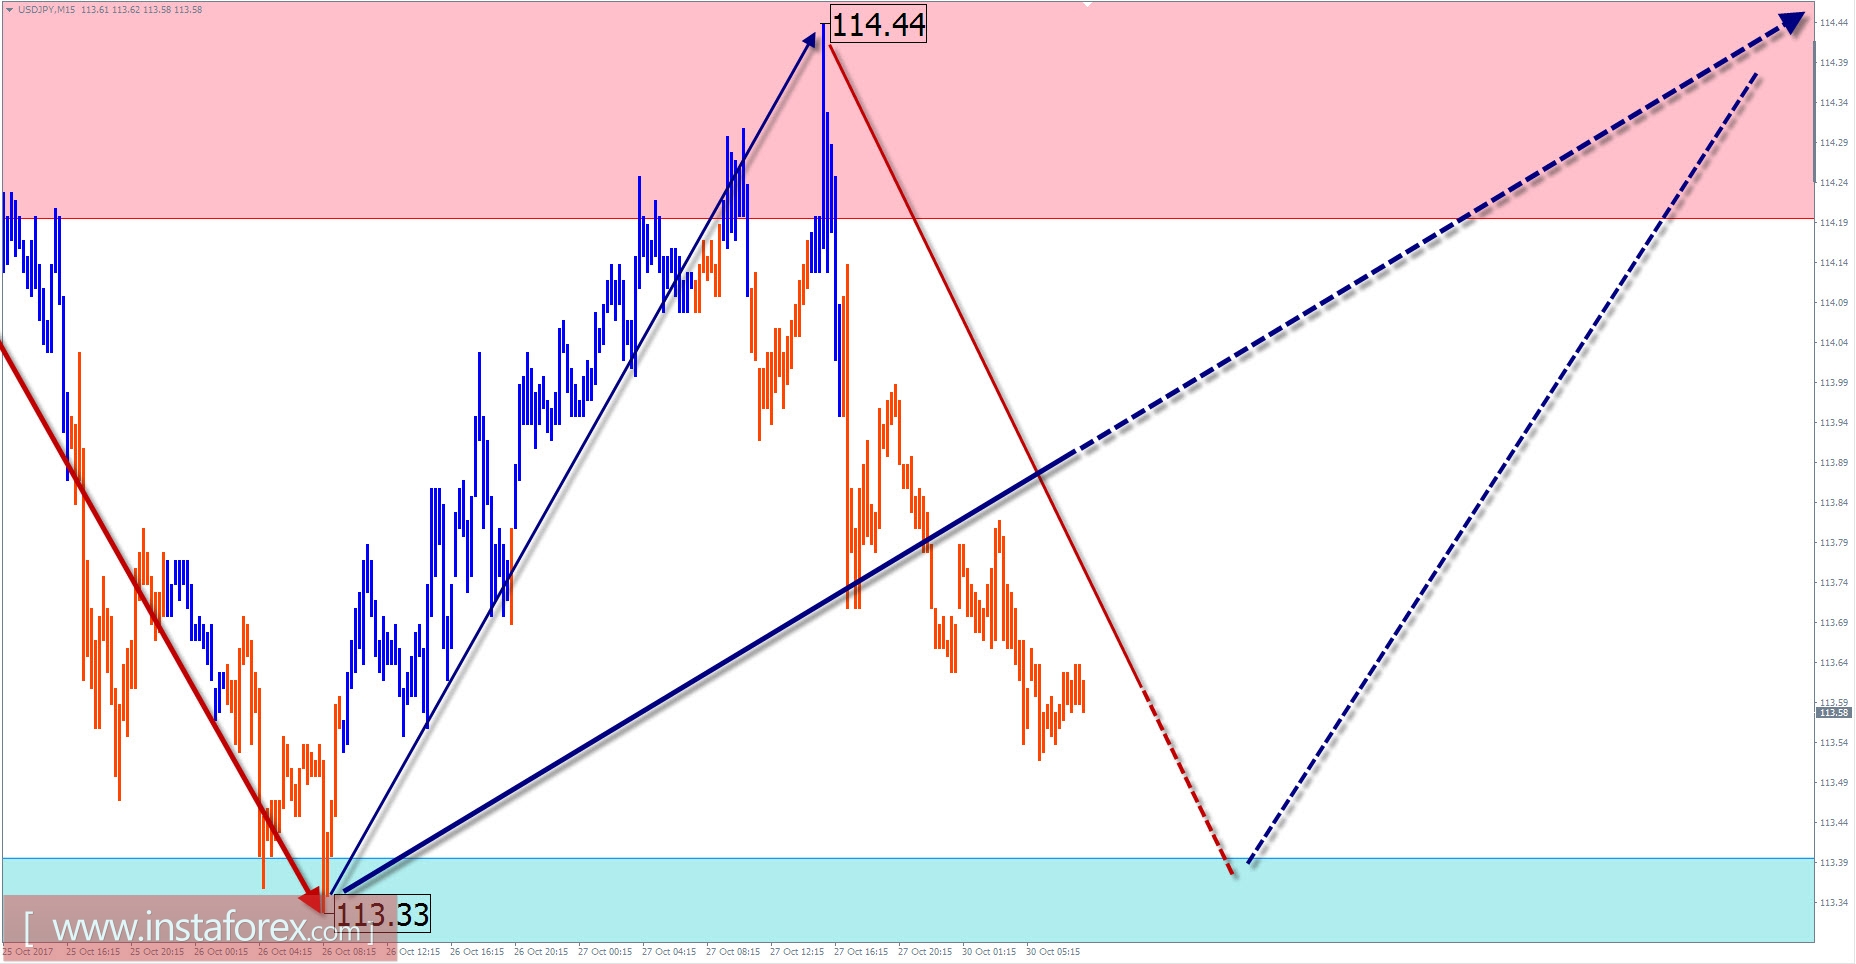
In the current year, the priority for the major Japanese currency pair was "outset". The wave analysis shows the formation of a descending model in this area whereas the middle part of the wave is approaching the end in recent months. The preliminary calculation indicates the possibility of the zone completion in a wide section of the chart positioned at the lower border where the price of the pair is situated in the past weeks. The zone of potential reversal has a width of about one and a half figures which is strengthened in the upper-bound region at the level of a large timeframe.
Most likely for today, the scenario will be the completion of the current drop from Friday and the beginning of a new stage of recovery. Turning is expected within the support zone.
Boundaries of resistance zones:
- 114.20 / 50
Boundaries of support zones:
- 113.40 / 10
Explanations to the figures: For simplified wave analysis, a simple waveform is used that combines 3 parts namely A, B, and C. All types of correction are created and most of the impulses can be found in these waves. Every time frame is considered and the last incomplete wave is analyzed.
The areas marked on the graphs indicate the probability of a change in the direction of motion has significantly increased as calculated in the areas. Arrows indicate the wave counting following the technique used by the author. A solid background of the arrows signifying the structure has been formed while the dotted one means the expected wave motion.
Attention: The wave algorithm does not take into account the duration of the movement of tools in time. The forecast is not a trading signal! To conduct a bargain, you need to confirm the signals used by your trading systems.


