


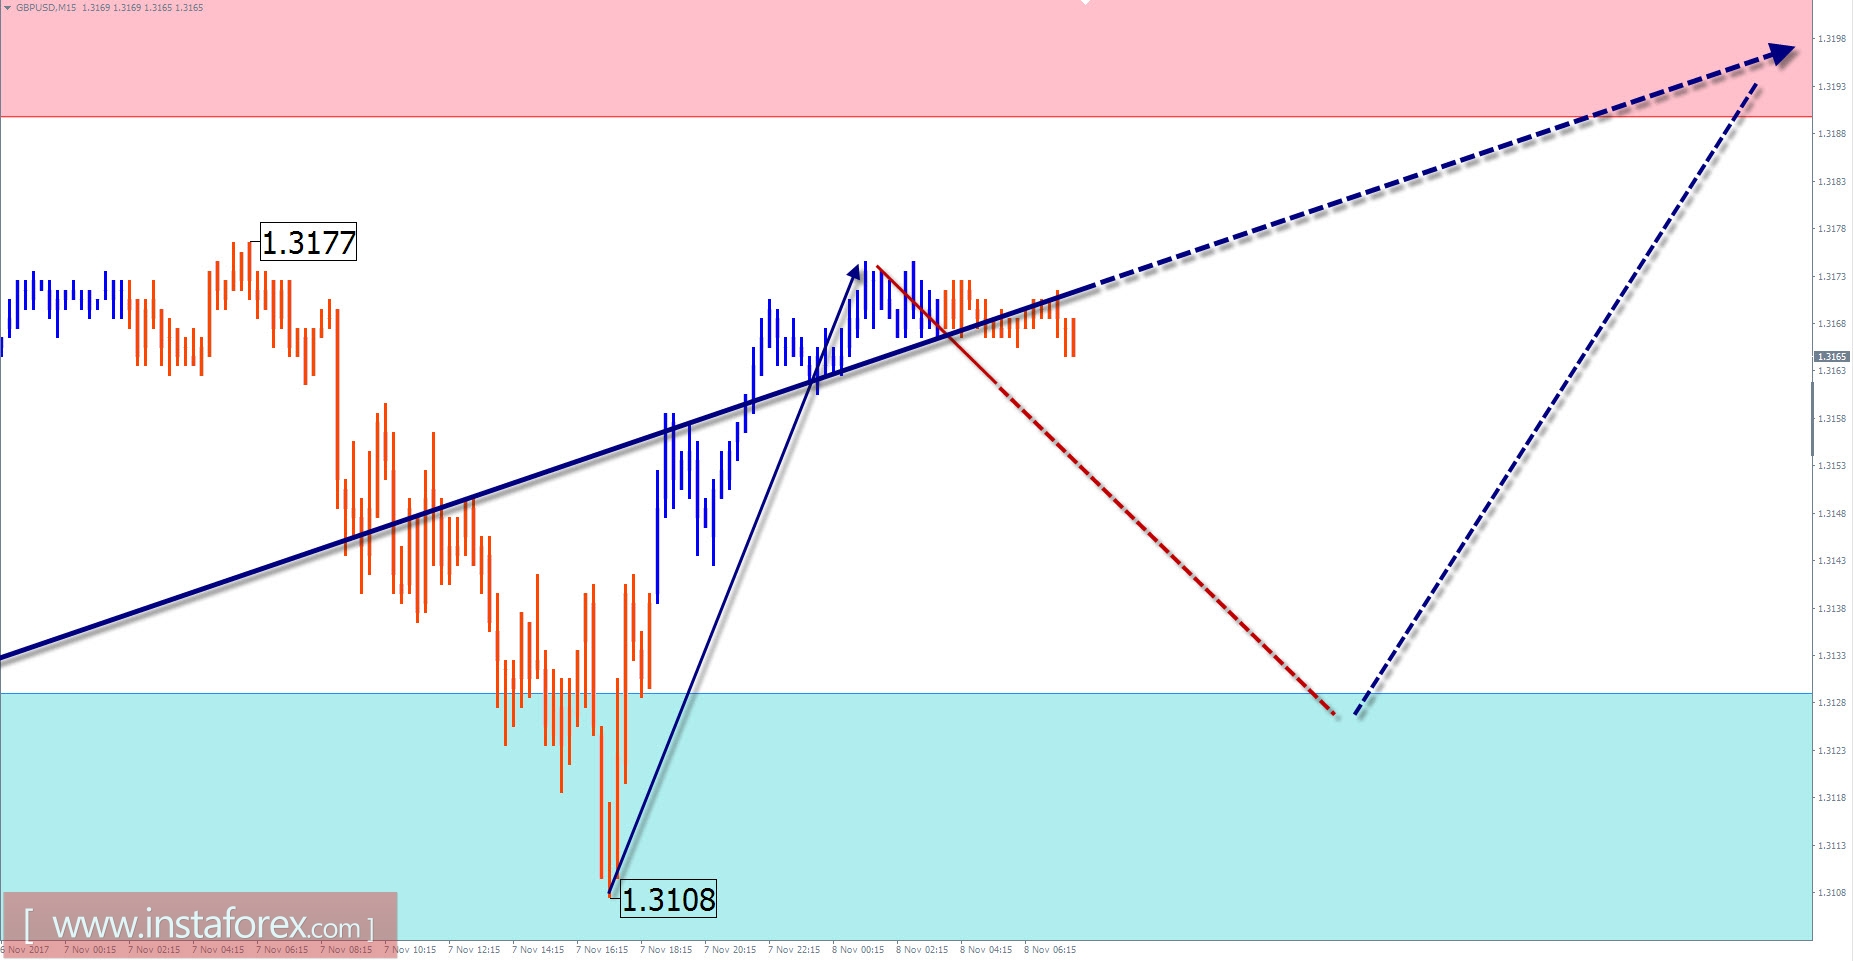
GBP / USD outlook for the current day
On the weekly chart of the British pound, the prevailing direction of the trend indicates a move to the "south" of the price region. Last year, the ascending segment forms a correction and showed a potential that is already close to completion. The structure of the wave indicates completeness. The price in late September reached the lower limit of the potential reversal zone. According to its wave level, the bearish wave that has further started is quite suitable for the position of reversal model. Over the past month, the middle part of this structure has formed in the entry point of the expanded flat. But for today, it seems sufficient for the final part.
In the first half of this day, the flat mode of movement more likely moves in a descending vector. The expected level of completion is within the support zone. Hence, a new burst of price uptrend activity can be expected. The forecasted upper limit of the daily volatility is indicated by the resistance zone.
Boundaries of resistance zones:
- 1.3190 / 1.3220
Boundaries of support zones:
- 1.3130 / 1.3100
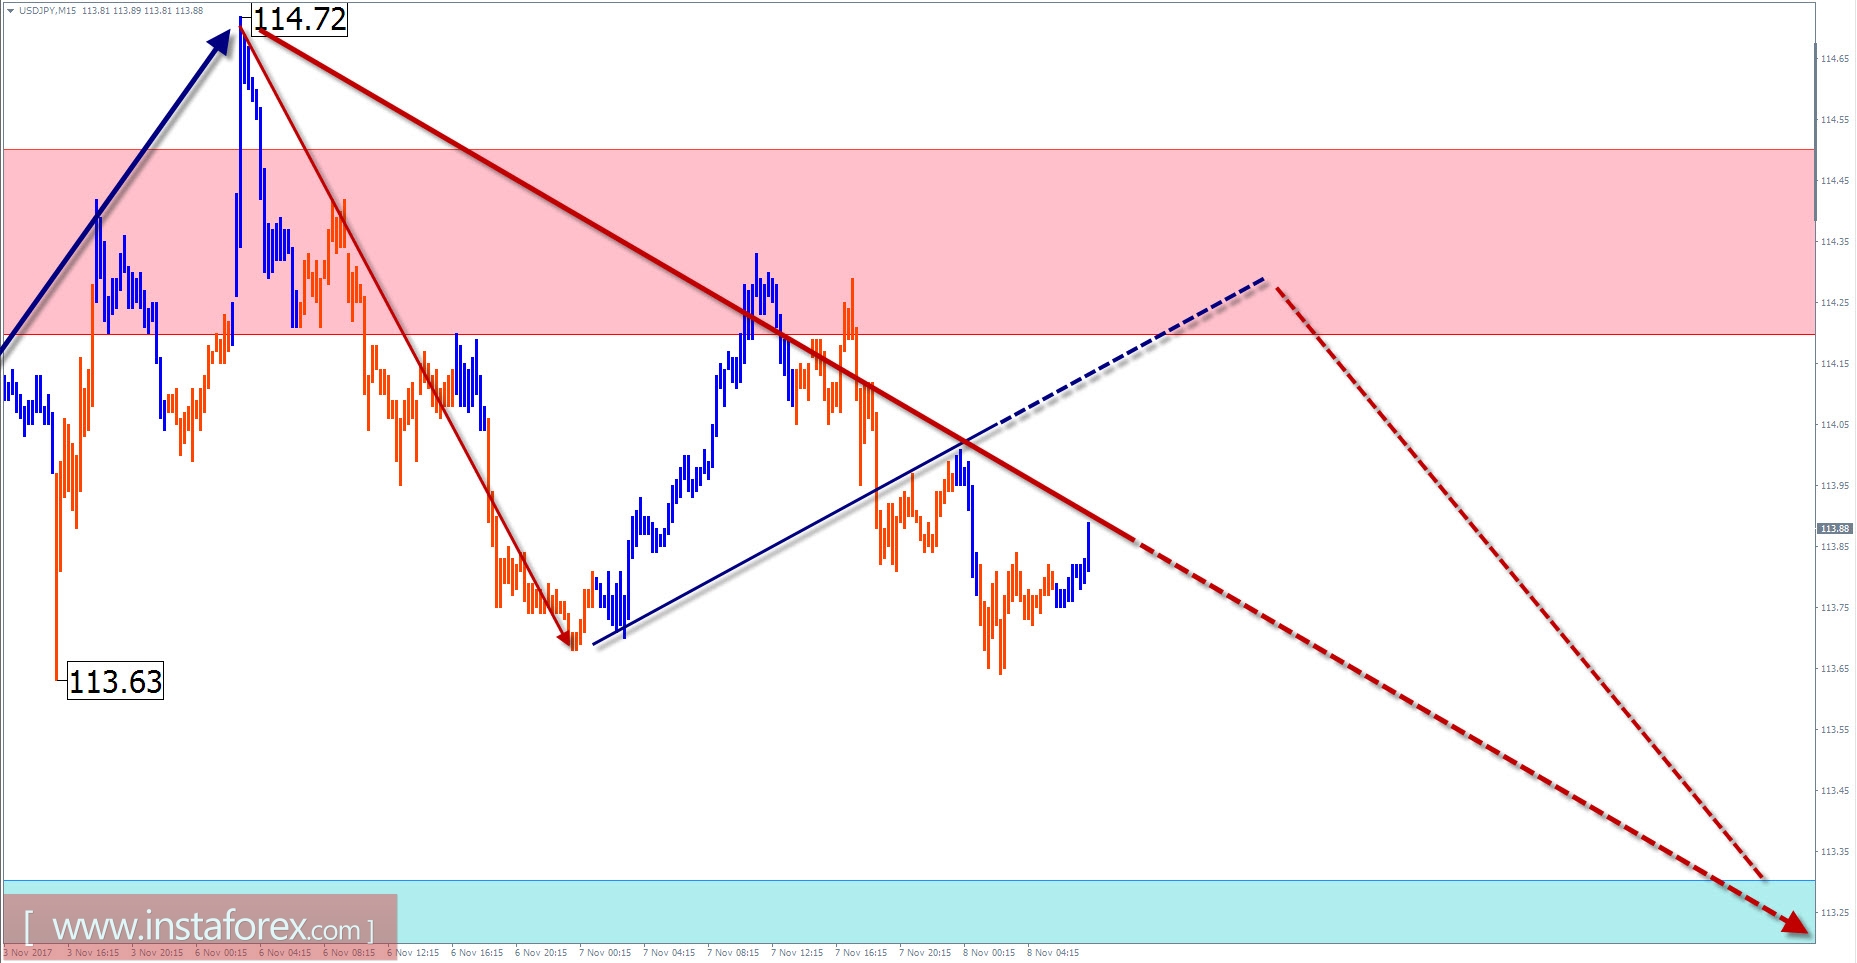
USD / JPY outlook for the current day
This year, the prevailing direction of the price trend for the major pair Dollar and Japanese yen shows a downward trend, with an overall flattened nature of the pair's fluctuations., The price direction has changed since September 8. Simplified wave analysis gives grounds to consider the correction wave completed. The current bullish area gave rise to a new wave of large scale. Quotations of the pair in the last 3 weeks prop up the lower boundary of the large-scale potential reversal zone, which triggered the formation of correcting part. Evaluating the current motion close to the impulse, it is not necessary to count on a large swing of the downward course.
At the next session for this day, it is possible to constrain the resistance zone again. In the second half of the day, there is a high probability of change in prices and a decrease in price values, up to the estimated support zone.
Boundaries of resistance zones:
- 114.20 / 50
Boundaries of support zones:
- 113.30 / 113.00
Explanations to the figures: For simplified wave analysis, a simple waveform is used that combines 3 parts (A; B; C). Of these waves, all kinds of correction are composed and most of the impulses. On each considered time frame the last and incomplete wave is analyzed.
The areas marked on the graphs are indicated by the calculation areas in which the probability of a change in the direction of motion is significantly increased. Arrows indicate the wave counting according to the technique used by the author. The solid background of the arrows indicates the structure formed, the dotted one indicates the expected wave motion.
Attention: The wave algorithm does not take into account the duration of the tool movements in time. The forecast is not a trading signal! To conduct a trade transaction, you need to confirm the signals of your trading systems.
* The presented market analysis is informative and does not constitute a guide to the transaction.


