


AUD / USD
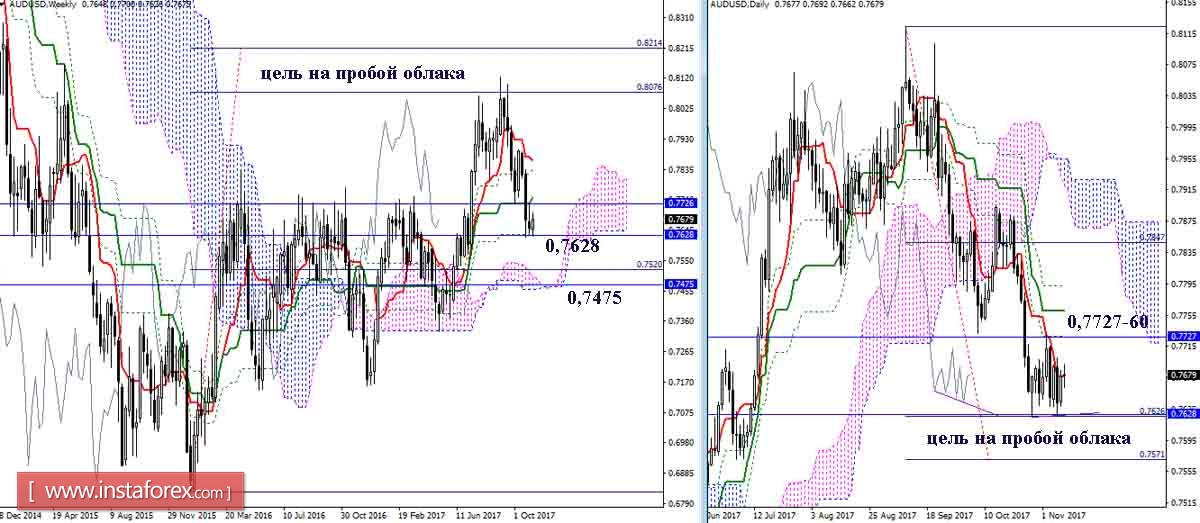
Having executed the upward target for the breakdown of the weekly cloud on the first target (0.8076), the pair began to decrease. To date, also on the first target (0.7626), worked out a day-to-day downward target for the breakdown of the cloud. The braking in support of the target benchmark (0.7626) led to the formation of a hidden bull divergence for Chinkou. As a result, we can expect some recovery in the future. The closest prospect for bulls in this case will be testing of the combined resistances of the medium-term trends (daily 0.7760 and weekly 0.7778).
The breakdown of support (0.7626) opens the way for 100% satisfaction of the daily target (0.7571) and further decrease to the weekly cloud, currently strengthened by the monthly Kijun (0.7475).
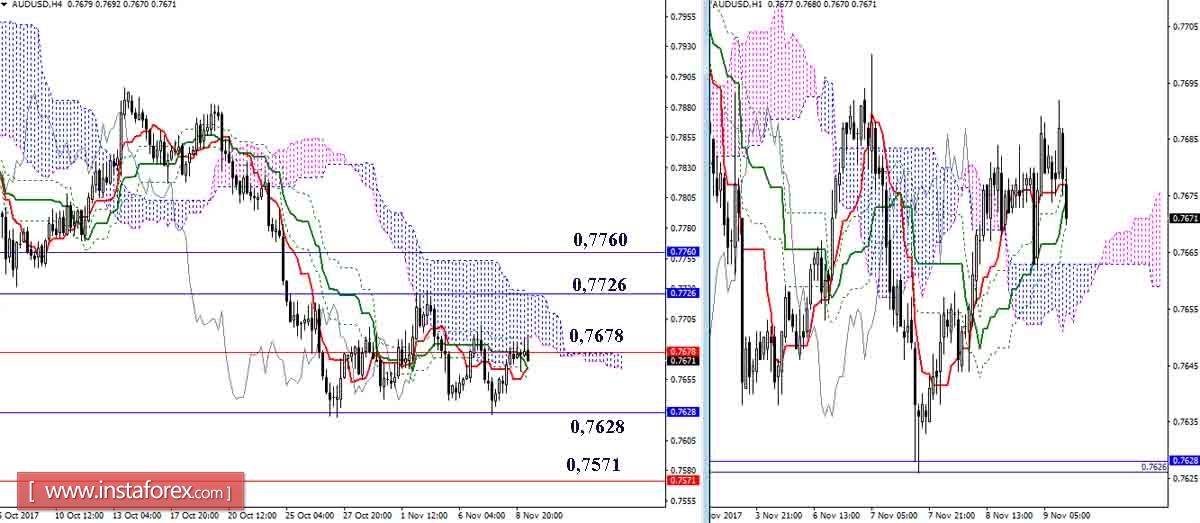
The long-term presence in the attraction zone of the daytime Tenkan (0.7678) was formed on the lower timeframes showing signs of the sideways trend, the boundaries of which are now served the levels of high-end times 0.7628 and 0.7726. Overcoming the resistance of 0.7726 and 0.7760 opens up new prospects for players to rise (at lower timeframes, this is the target for breaking down the H4 cloud). The breakdown of the current support (0.7626), most likely, will lead the pair at 0.7571.
USD / JPY
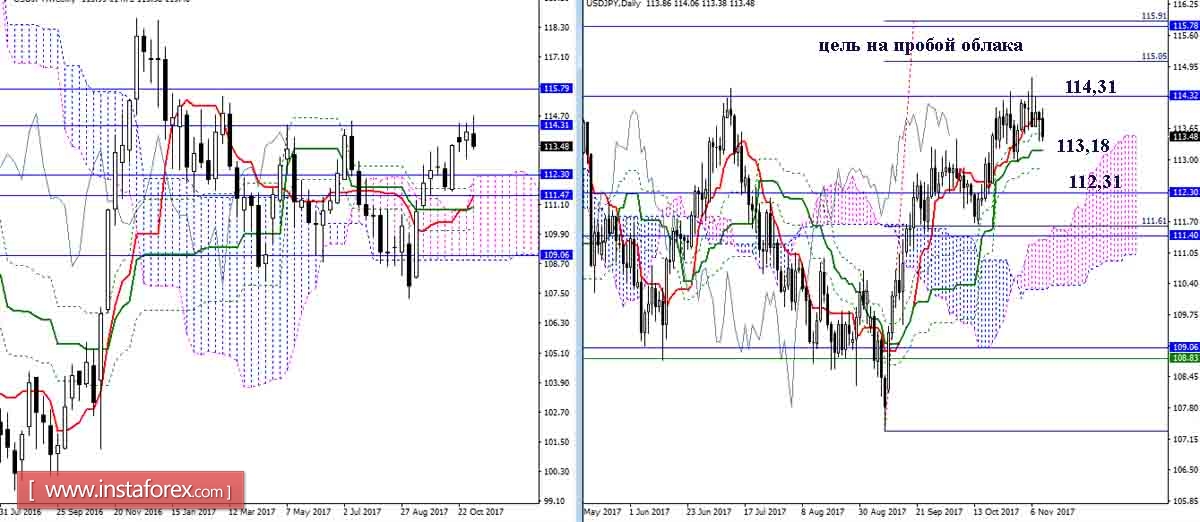
The Fibo Kijun resistance at 114.31. The Fibo Kijun resistance at 114.31. As a result, there has recently been a consolidation and a downward correction. The nearest support zone is currently located at the final border of the daytime cross (Kijun 113.18 + 112.82). In case of a breakdown of the daytime cross, one can expect a decrease in the area of 112.31.
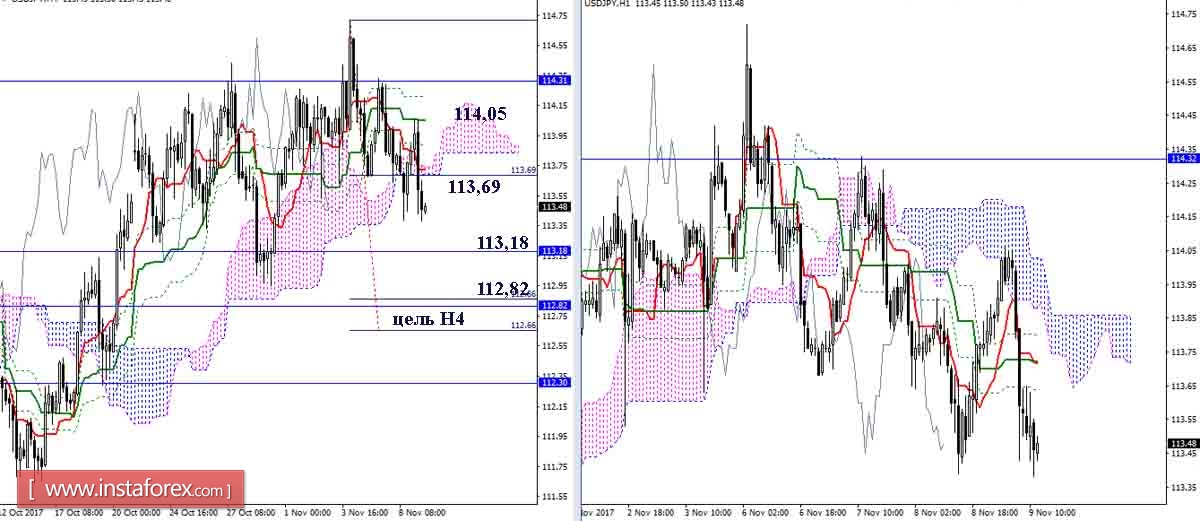
At the lower timeframes, players on the slide aim at escape from the cloud H4 attraction (113.69) and continue the decline through the target area at the breakdown of the cloud. The fulfillment of the goal will lead to several attempts for the final boundaries of the day cross (113.18 + 112.82). Resistance for today can be seen at 114.05 and 114.31.
Indicator parameters:
all time intervals 9 - 26 - 52
The color of indicator lines:
Tenkan (short-term trend) - red,
Kijun (medium-term trend) - green,
Fibo Kijun is a green dotted line,
Chinkou is gray,
clouds: Senkou Span B (SSB, long-term trend) - blue,
Senkou Span A (SSA) - pink.
The color of additional lines:
support and resistance MN - blue, W1 - green, D1 - red, H4 - pink, H1 - gray,
horizontal levels (not Ichimoku) - brown,
trend lines - purple.
* The presented market analysis is informative and does not constitute a guide to the transaction.


