


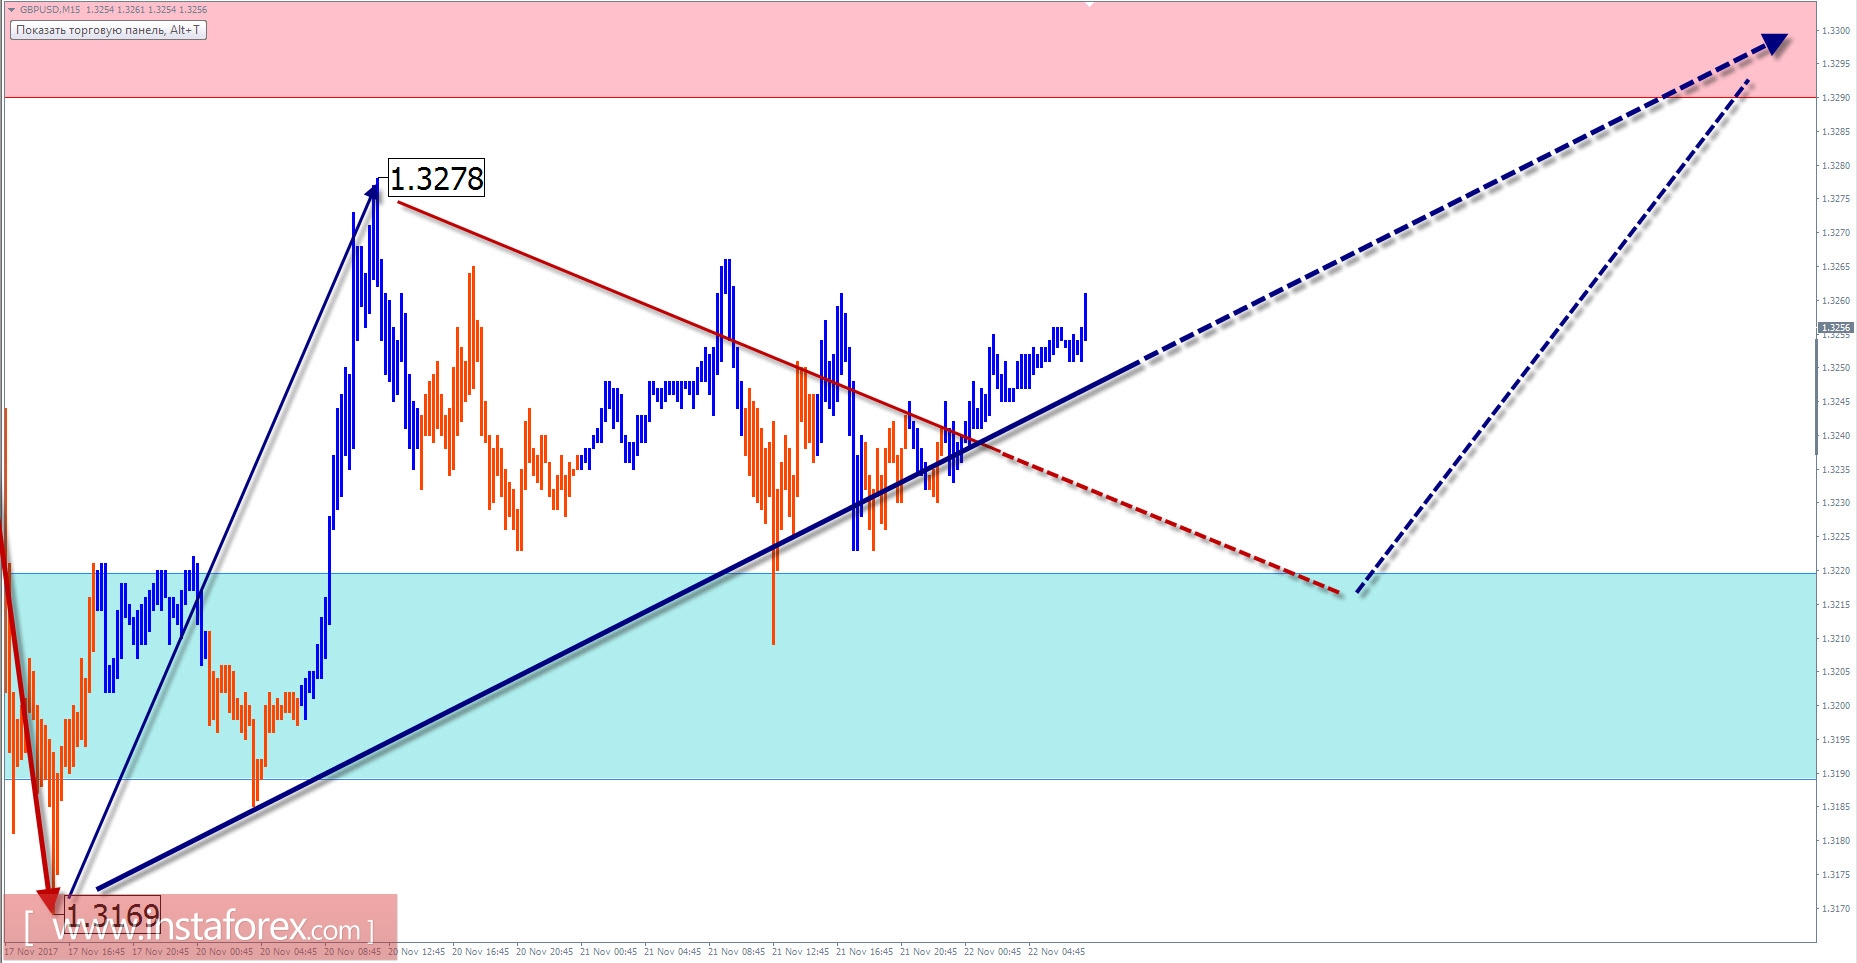
GBP / USD outlook for the current day
As a result of the upward trend in the majeure of the English currency, prices approached the lower boundary of the calculated target zone. A bearish wave is forming since mid-September. Its wave level makes it possible to classify the movement toward reversal structures. Currently, the middle part of the model is being formed. Preliminary calculation indicates possible rate increase of at least 2 price figures from the current values.
On a smaller scale, the trend price curve is set by the upward wave of November 2. The final section wave structure remains incomplete.
Today, the flat tone of fluctuations is expected. At the next session, the probability of a downward vector is not excluded, nor beyond the limits of support. Waiting for a change in direction is necessary as well as the increase in volatility, with the prospect of breaking through the resistance zone.
Boundaries of resistance zones:
- 1.3290 / 1.3320
Boundaries of support zones:
- 1.3220 / 1.3190
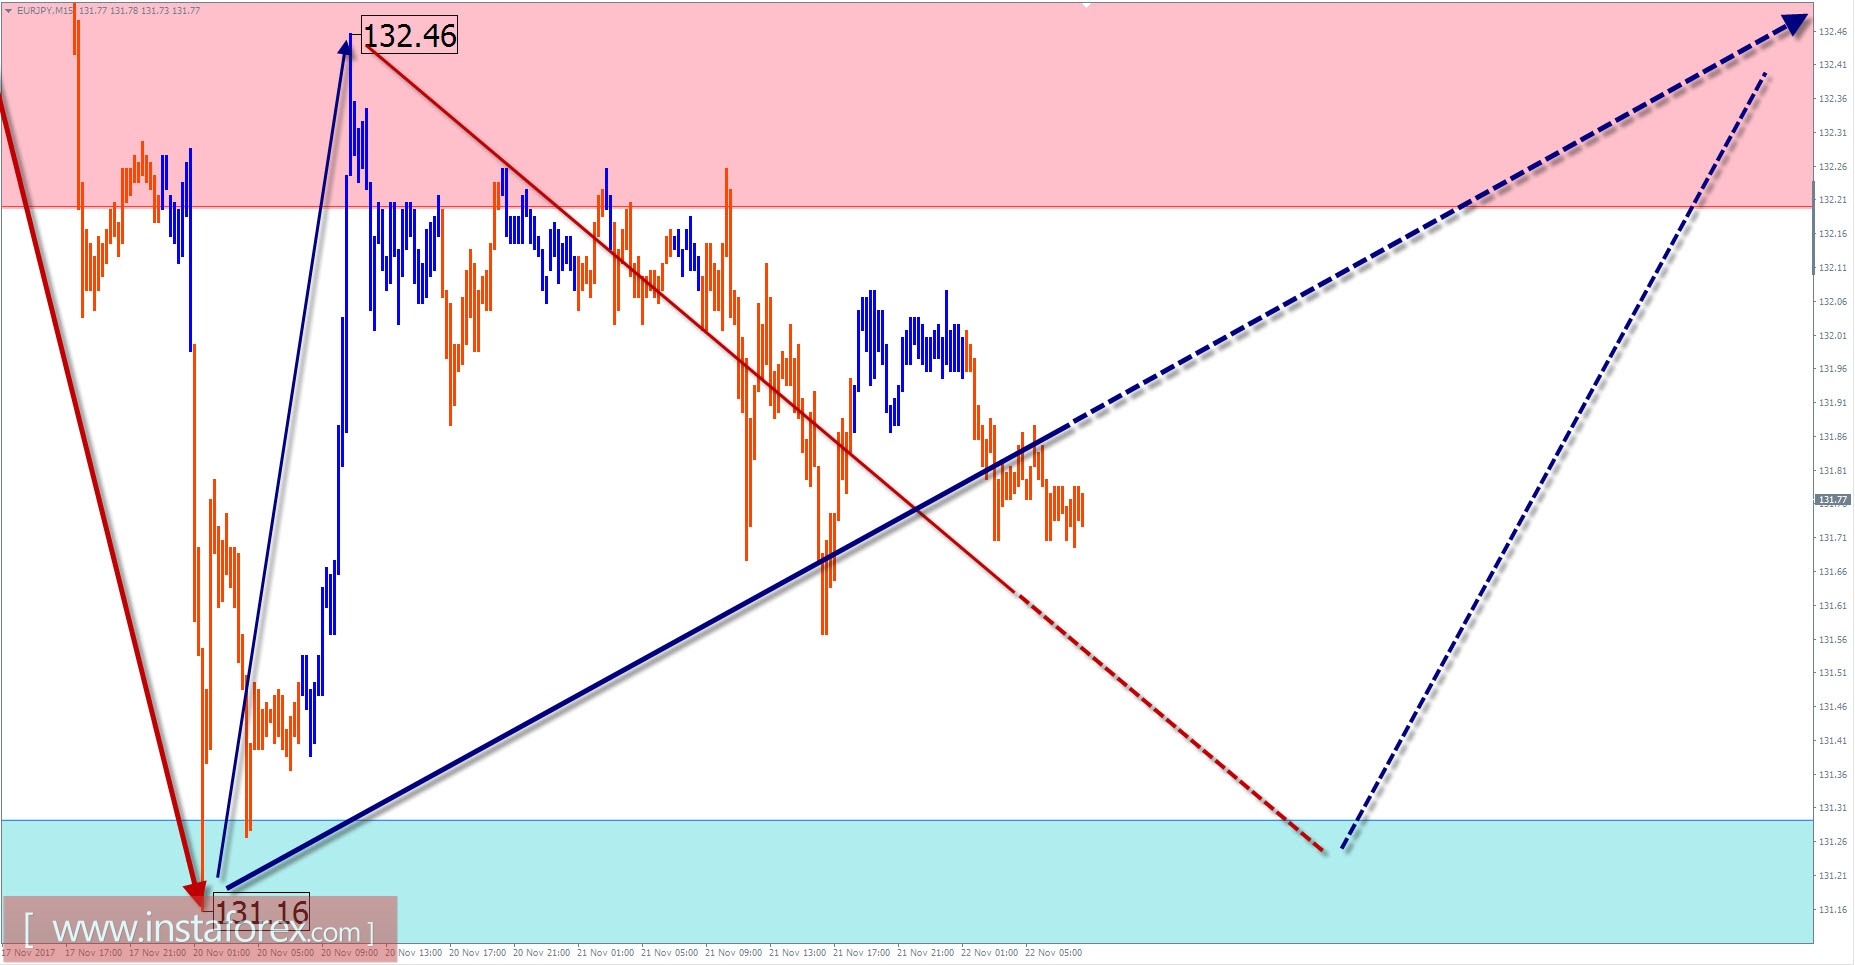
EUR / JPY outlook with current day forecast
At the end of the rising wave of the instrument, during the last 3 months, a flat wave structure is formed. In the general structure of the main trend, this area takes the place of correction of the last section (C).
The bearish wave structure is almost completed. At the end of the last descending section during the beginning of this week, the bullish movement has started with the wave level which exceeds the size of rollback. There is a high degree of possibility that the beginning of the reversal zigzag will take place.
During the current day, the completion of the middle part of the wave is expected, along with the reversal formation and the beginning of a price hike. The lower zone is the support zone. Breakthrough of the upper boundary of the resistance zone is not possible today.
Boundaries of resistance zones:
- 132.20 / 50
Boundaries of support zones:
- 131.30 / 131.00
Explanations to the figures: For simplified wave analysis, a simple waveform is used that combines 3 parts (A; B; C). Of these waves, all kinds of correction are composed and most of the impulses. On each considered time frame the last and incomplete wave is analyzed.
The areas marked on the graphs are indicated by the calculation areas in which the probability of a change in the direction of motion is significantly increased. Arrows indicate the wave counting according to the technique used by the author. The solid background of the arrows indicates the structure formed, the dotted one indicates the expected wave motion.
Attention: The wave algorithm does not take into account the duration of the tool movements in time. The forecast is not a trading signal! To conduct a trade transaction, you need to confirm the signals of your trading systems.
* The presented market analysis is informative and does not constitute a guide to the transaction.


