


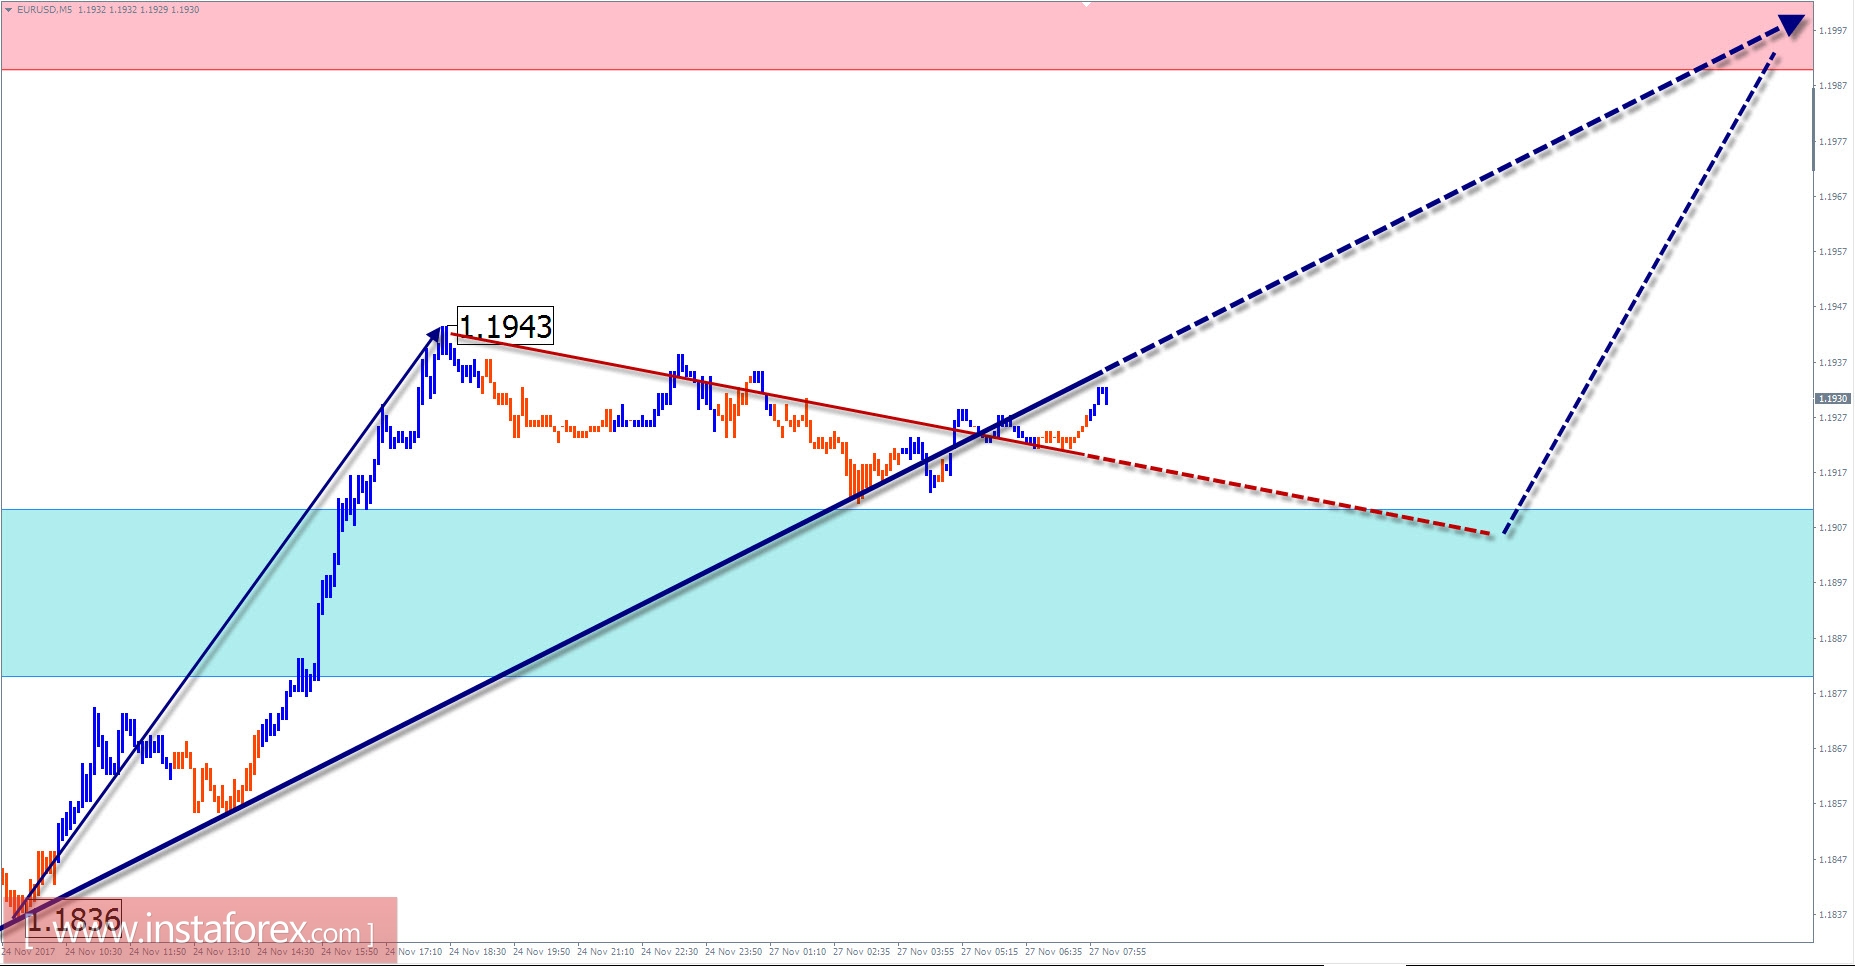
EUR / USD outlook for the current day
The schedule of a major pair of the European currency in the last 2 years forms a wave model "a rising stretched plane". The last part of the movement has reached the minimum size of the elongation, after which the completion of the entire structure became possible. There is a potential turn zone in this area of the plot which was reinforced by a large scale. The absence of the formation of a downward reversal wave in a suitable wave level is a powerful prerequisite for the continuation of the current trend.
The contact of the price with the zone of potential reversal provoked the formation of the correctional wave, which started from August 29. In the structure of this wave, the first part of the movement (A) is formed and the middle part (B) is nearing completion. The preliminary calculation shows the probable level of completion of the price increase in the area of local highs in September.
The completion of a downward rollback is expected for today. A short-term puncture of the lower boundary of the support zone is possible, but unlikely. Return to the upward course can be expected at the end of the day or tomorrow.
Boundaries of resistance zones:
- 1.1990 / 1.2020
Boundaries of support zones:
- 1.1910 / 1.1880
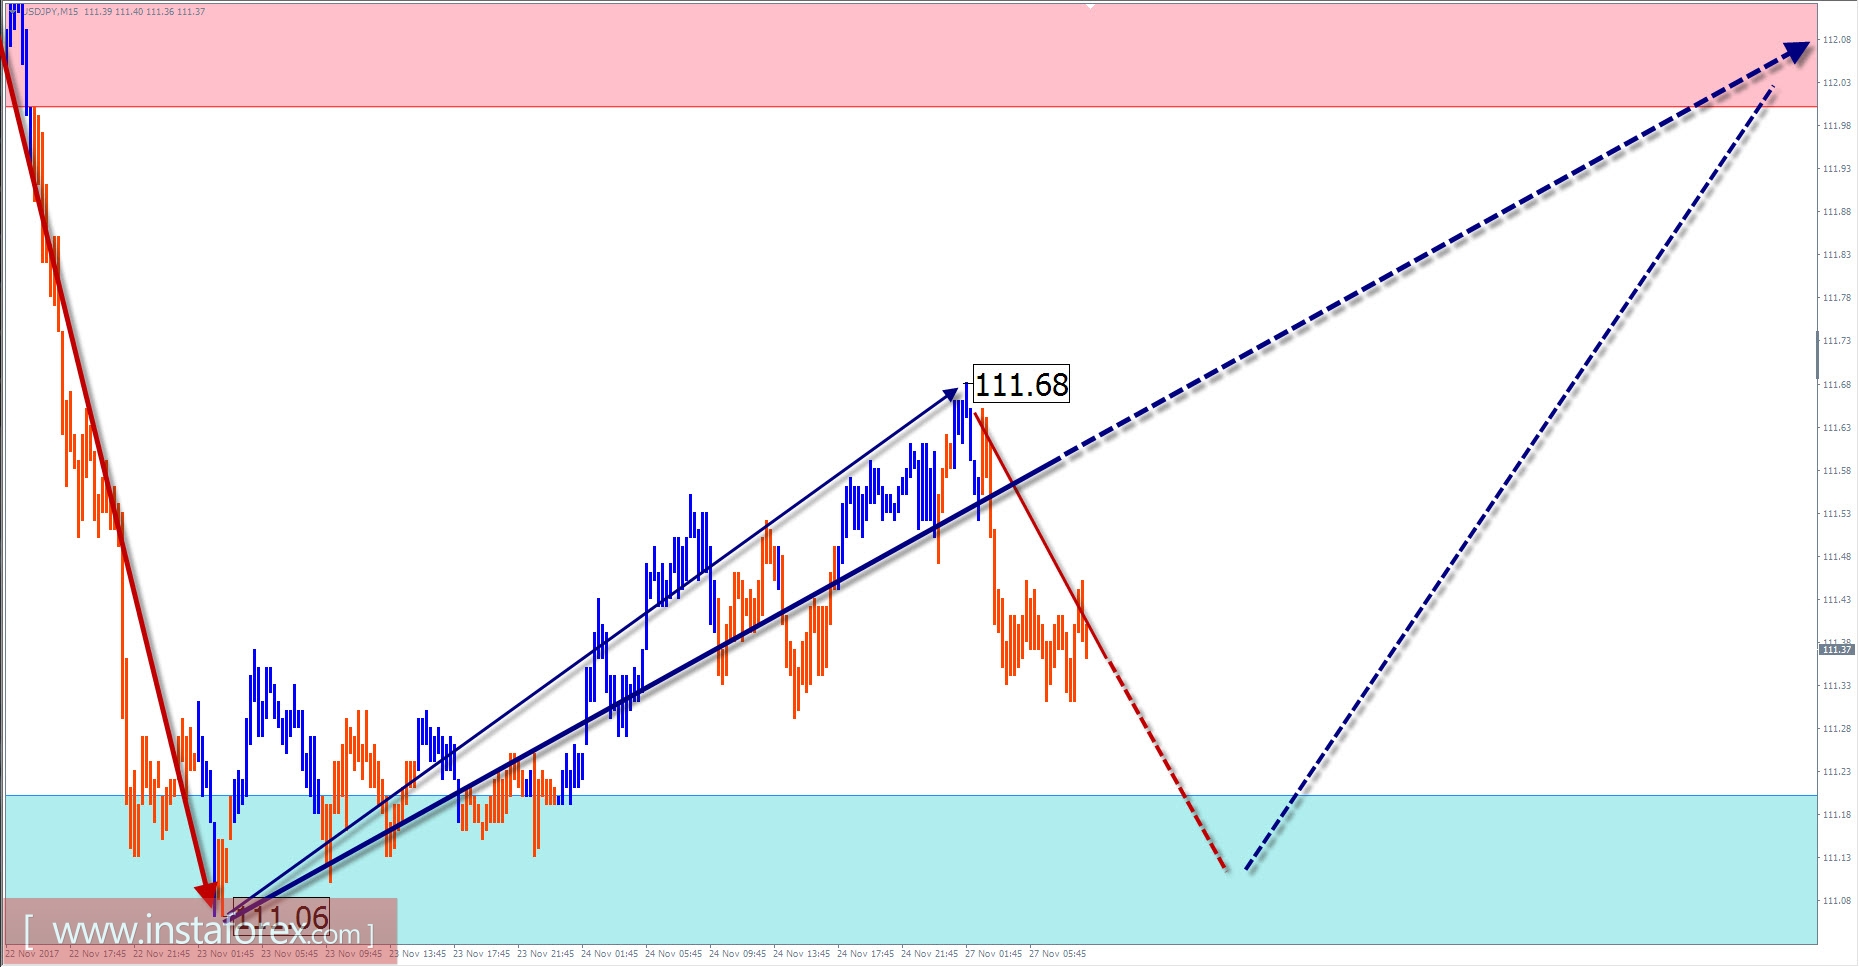
USD / JPY outlook for the current day
The short-term trend direction on the price chart of the Japanese yen against the dollar major pair is set by the upward wave of September 8.
The wave develops towards the main long-term trend that makes it closer to the momentum. In the wave structure in the middle, the correcting part (B) is nearing completion. The form of correction is incorrect with an upward elongation. The price is found in the area of lower limit with a potential turn.
Today, the flat tone of the pair's fluctuations is expected in the first half of the day. A downward motion vector is likely. Toward the end of the day, the chance of changing the direction of the intersessional trend increases and the growth of valuable quotations. The zone of resistance shows the upper limit of the course of the pair for the day.
Boundaries of resistance zones:
- 112.00 / 112.30
Boundaries of support zones:
- 111.20 / 110.90
Explanations to the figures:
For simplified wave analysis, a simple waveform is used that combines 3 parts namely A, B, and C. All types of correction are created and most of the impulses can be found in these waves. Every time frame is considered and the last incomplete wave is analyzed.
The areas marked on the graphs indicate the probability of a change in the direction of motion has significantly increased as calculated in the areas. Arrows indicate the wave counting following the technique used by the author. A solid background of the arrows signifying the structure has been formed while the dotted one means the expected wave motion.
Attention: The wave algorithm does not take into account the duration of the movement of tools in time. The forecast is not a trading signal! To conduct a bargain, you need to confirm the signals used by your trading systems.


