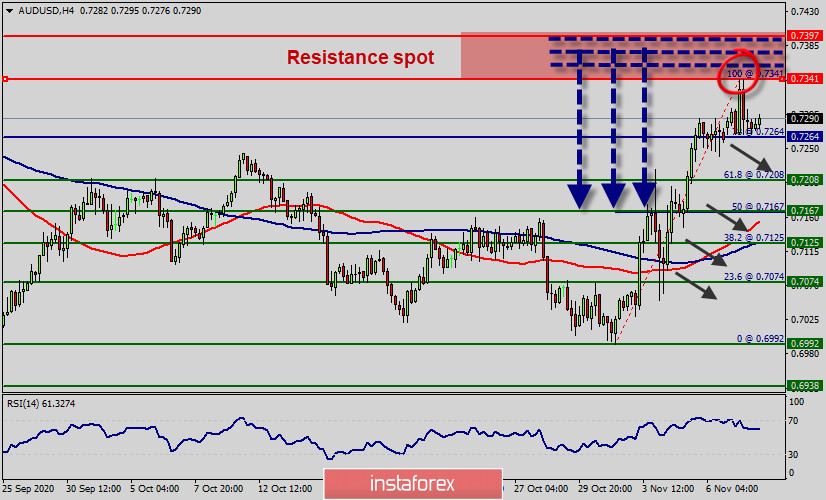
- Pair : AUD/USD.
- Pivot : 0.7264.
- Trend : Bullish.
- Forecast : Setting up for a strong reversal, prepare to sell on break of support 0.7264.
A higher top was formed at the level of 0.7341 and the bulls showed their power again as the market shot through the 50 and 100 Simple Moving Averages and the RSI continued higher above the 50 baseline into positive terrain.
The UAUD/USD pair has faced strong resistances at the levels of 0.7341. So, the strong resistance has already formed at the level of 0.7341 and the pair is likely to try to approach it in order to test it again.
However, if the pair fails to pass through the level of 0.7341, the market will indicate a bearish opportunity below the new strong resistance level of 0.7341. Thus, the market is indicating a bearish opportunity below the spot of 0.7341 - 0.7397.
Thus, if the trend fails breaks through the previous higher top and critical resistance level at 0.7341, then three possible price targets may be calculated from there. Applying the Fibonacci tool to the top of the resistance level at 0.7341 and dragging it to a possible support level near the 100 Simple Moving Average at 0.7274, the following targets could be considered.
The first target could be estimated at 0.7280 (61.8 % of Fibonacci retaracement levels). The second price target might be considered at 0.7167 (50%) and the third and final target may be projected at 0.7125 (38.2%).
On the other hand, currently, the market is in a bullish channel. According to the previous events, we expect the AUD/USD pair to move between 0.7208 and 0.7341. On the H4 chart, resistance is seen at the levels of 0.7341 and 0.7379.
Also, it should be noticed that, the level of 0.7241 represents the daily pivot point. Therefore, strong support will be formed at the level of 0.7341 providing a clear signal for buy deals with the targets seen at 0.7341. If the trend breaks the support at 0.7341 (first resistance) the pair will move upwards continuing the development of the bullish trend to the level 0.7379 in order to test the daily resistance 2.
But, the price spot of 0.7341 /0.7379 remains a significant resistance zone. Therefore, the possibility that the Aussie will have a downside momentum is rather convincing and the structure of the fall does not look corrective. In order to indicate a bearish opportunity below the area of 0.7341 /0.7379, it will be a good signal to sell below 0.7341/0.7379 with the targets indicated above.


