


EUR/USD
To open long positions for EURUSD, it is required:
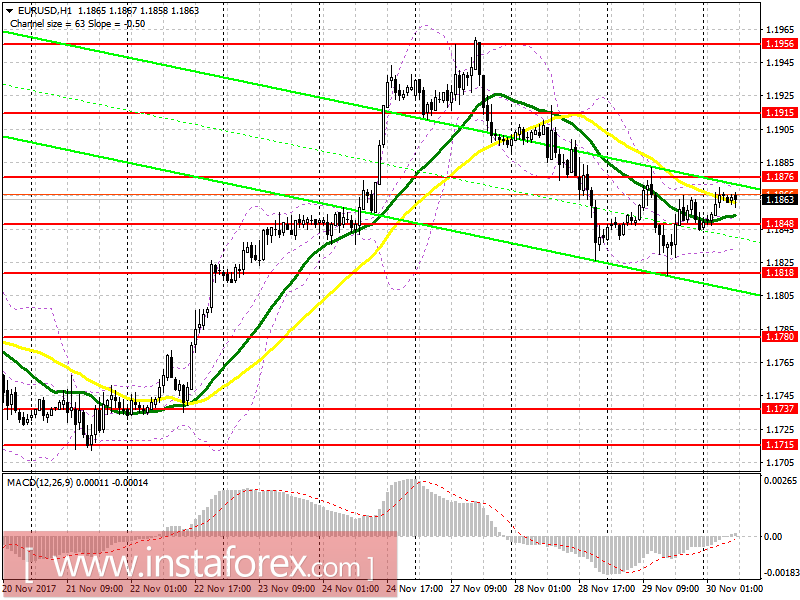
It would be best to consider new long positions after the breakdown of the level of 1.1876, which was attempted yesterday but failed. A consolidation on it will lead to the renewal of the larger resistance area of 1.1915 with the main goal of reaching the high of the week in the region of 1.1956, where it is advised to lock in the profit. The formation of a false breakout and a return to the level of 1.1848 will also be a good signal for buying the euro. Otherwise, opening new long positions would be best after updating 1.1818.
To open short positions for EURUSD, it is required:
A false breakout and a return to the level of 1.1876, just like yesterday, will be the first signal to open short positions for the purpose of a breakdown and consolidation below 1.1848, which will lead to a larger selling with a test at 1.1818 and the main goal of exit at 1.1780, where it is advised to lock in profits. In the event of a growth above 1.1876, you can consider short positions after updating 1.1915, or on a rebound from 1.1956.
GBP/USD
To open long positions for GBP/USD, it is required:
The fastening above 1.3474 will be a good signal for opening long positions in the pound with the main target of the exit at 1.3509 and the update at 1.3562, where it is advised to lock in the profit. In case the pound drops in the morning, it would be best to consider new long positions after upgrading 1.3435 or on a rebound from 1.3377.
To open short positions for GBP/USD, it is required:
An unsuccessful attempt at growth above 1.3474 with a return to this level will be the first signal for opening short positions on the pound with an outlook to reaching 1.3425, where buyers will return to the market. Only a break below support of 1.3425 could lead to a larger sellout of the GBP/USD pair in the area of 1.3377 and 1.3338, where it is advised to lock in profits. In the event of growth above 1.3474, returning to short positions would be best done after updating 1.3509 or on a rebound from 1.3562.

Indicator description
- Moving Average (average sliding) 50 days - yellow
- Moving Average (average sliding) 30 days - green
- MACD: fast EMA 12, slow EMA 26, SMA 9
- Bollinger Bands 20


