Technical Market Outlook:
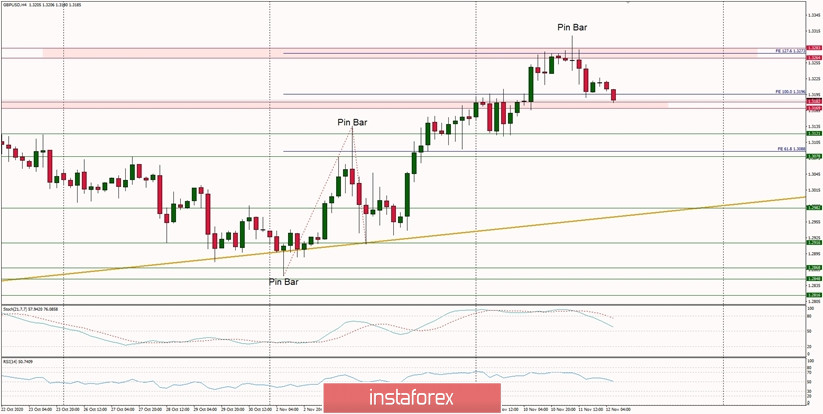
After the GBP/USD pair has extended the rally towards the level of 1.3273, which is a 127% Fibonacci extension of the last wave up, the rally was capped, because a Pin Bar and then a Shooting Star candlestick were made at its top. Moreover, the market has hit the technical resistance located at the level of 1.3282, so some kind of pull-back should be expected. Currently, the price is testing the nearest technical support at the level of 1.3182. The next technical support is seen at the level of 1.3169 and 1.3121. Please notice, the market is coming off the overbought conditions, which supports the short-term bearish outlook.
Weekly Pivot Points:
WR3 - 1.3631
WR2 - 1.3400
WR1 - 1.3312
Weekly Pivot - 1.3083
WS1 - 1.2991
WS2 - 1.2762
WS3 - 1.2666
Trading Recommendations:
The GBP/USD pair is in the down trend on the monthly time frame, but the recent bounce from the low at 1.1411 made in the middle of March 2020 looks very strong and might be a reversal swing. In order to confirm the trend change, the bulls have to break through the technical resistance seen at the level of 1.3518. All the local corrections should be used to enter a buy orders as long as the level of 1.2674 is not broken.