


AUD / USD overview with current day forecast
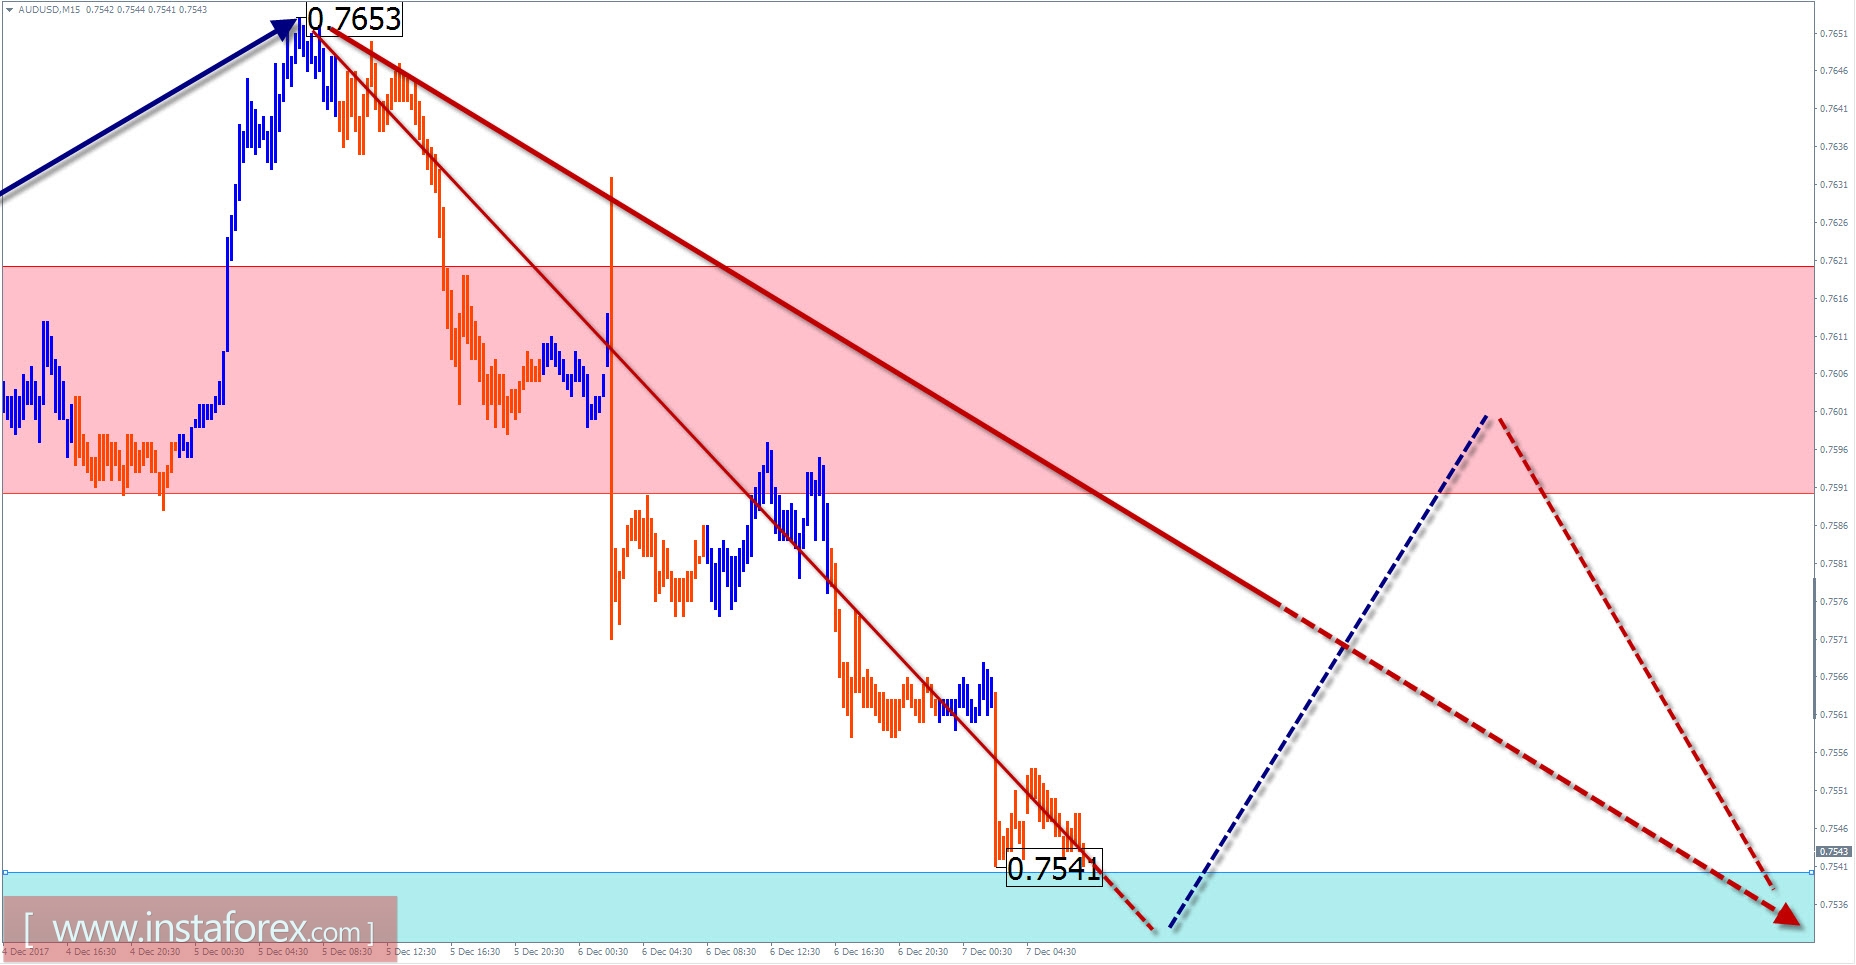
The medium-term trend of the major pair USD and Australian dollar, since January last year, moves the price of the pair upwards. In a larger wave model, this area formed a correction showing a potential close to exhaustion. At the end of the summer, the price reached the estimated level of elongation in the reversal zone.
Since September 8, the bearish wave created a new short-term trend for the AUD/USD pair. The preliminary calculation of the target zone creates an expectation to decrease at least 2 price figures down in the rate.
Before the continuation of the main direction of the trend today, the pair awaits for a corrective flat probably in the morning. A reversal of the main downward motion trend can be expected at the end of the day or tomorrow.
Boundaries of resistance zones:
- 0.7590 / 0.7620
Boundaries of support zones:
- 0.7540 / 10
GBP / JPY outlook for the current day
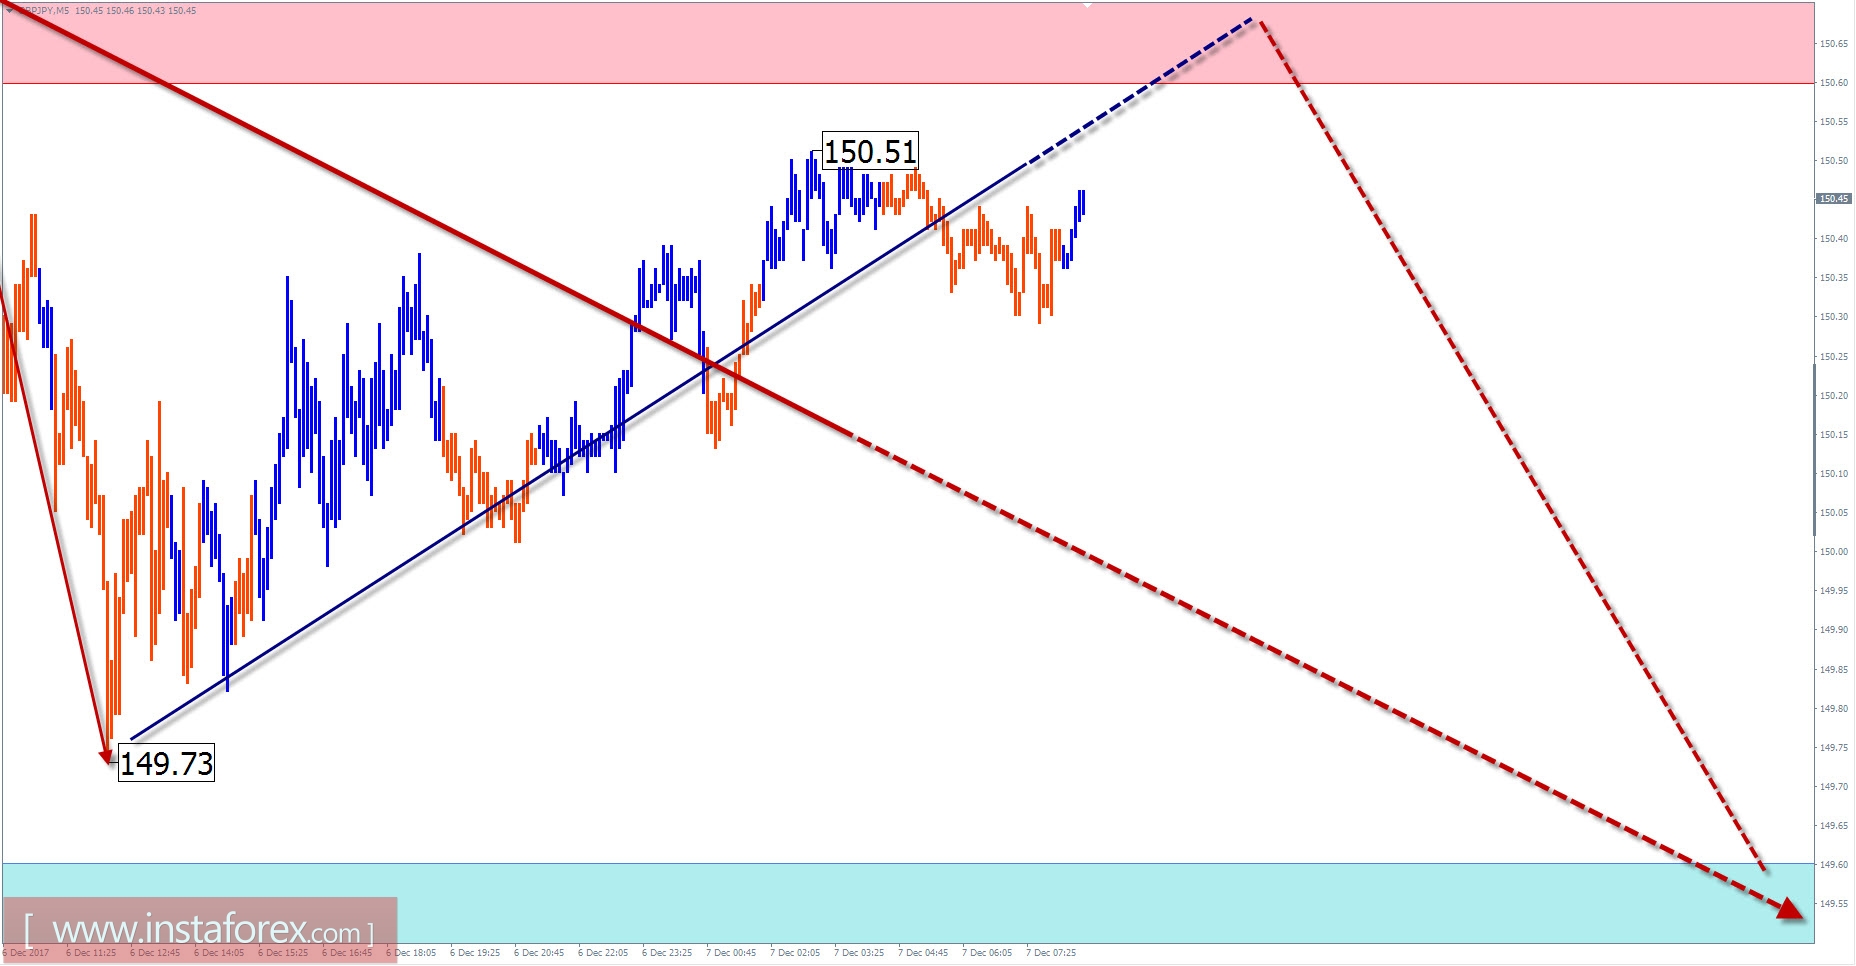
On the daily chart scale of the cross British pound / Japanese yen, the rising wave reached the estimated level. By the beginning of autumn, the wave structure was fully formed. From mid-September, a reversal structure forms along the lower boundary of the reversal zone. Its ending will give rise to a counter wave of the same wave level as the previous trend.
In the bearish wave, the formation of a correcting phase (B) is almost complete. Given the shape of the reversal pattern, a change in the trend direction is possible in the region of the 154th price figure.
In the following days, it is expected that the current downward price retracement will be formed in the last days. Furthermore, the price is waiting for a change in the direction of the intersessional trend within the boundaries of the support zone.
Boundaries of resistance zones:
- 150.60 / 90
Boundaries of support zones:
- 149.60 / 30
Explanations to the figures: For simplified wave analysis, a simple waveform is used that combines 3 parts (A; B; C). Of these waves, all kinds of correction are composed and most of the impulses. On each considered time frame the last and incomplete wave is analyzed.
The areas marked on the graphs are indicated by the calculation areas in which the probability of a change in the direction of motion is significantly increased. Arrows indicate the wave counting according to the technique used by the author. The solid background of the arrows indicates the structure formed, the dotted one indicates the expected wave motion.
Attention: The wave algorithm does not take into account the duration of the tool movements in time. The forecast is not a trading signal! To conduct a trade transaction, you need to confirm the signals of your trading systems.
* The presented market analysis is informative and does not constitute a guide to the transaction.


