


Review and forecast for GBP / USD
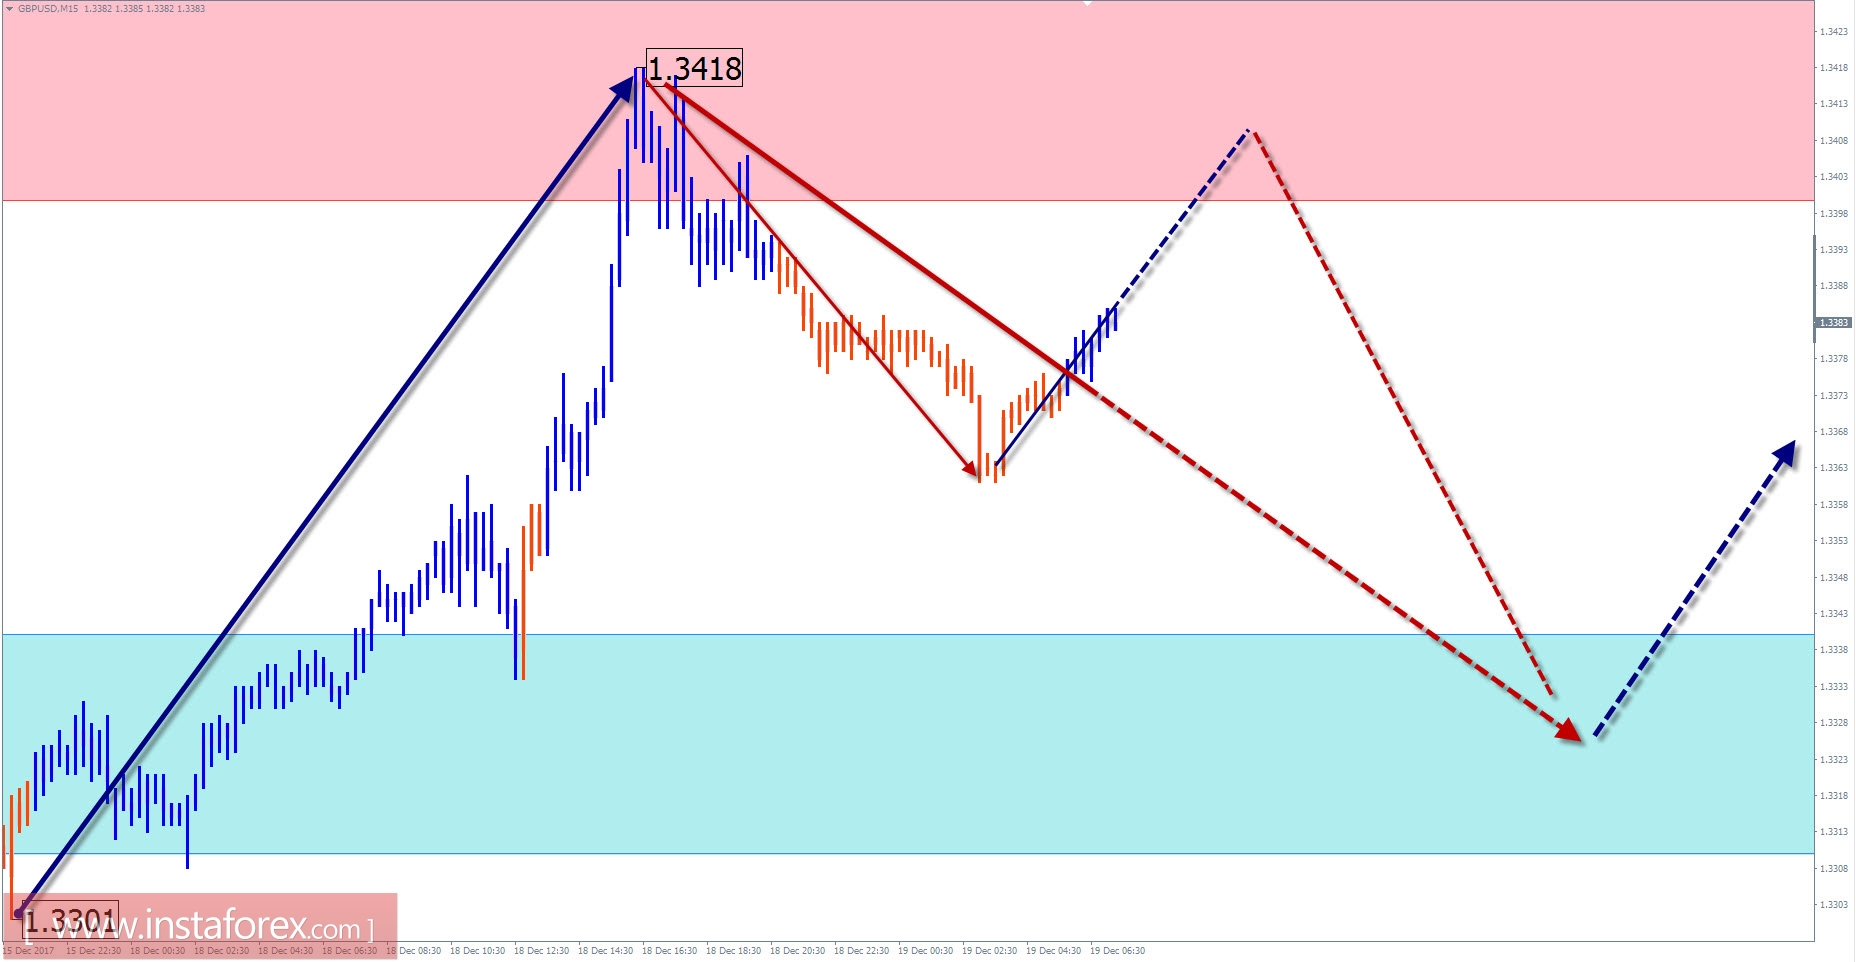
The major currency British pound has reached the lower limit of the potential turn zone. Considering the completeness of the main bull wave structure on the daily scale chart. Hence, a counter-motion can be anticipated.
The sequence of price fluctuations in the recent months coincides with the algorithm of the last, incomplete for today's downward wave. It counts from the middle of September. Its wave level exceeds the size of the rollback from the last section of the trend. The development of the middle part of the wave (B) entered the final phase.
Today, fluctuations in the exchange rate of the pair are possible. In the morning, an upward price movement is expected. Further, it is planned to change direction and price course downwards within the limits of the calculated resistance zone.
Boundaries of resistance zones:
- 1.3400 / 1.3430
Boundaries of support zones:
- 1.3340 / 10
Review and Forecast for AUD / JPY
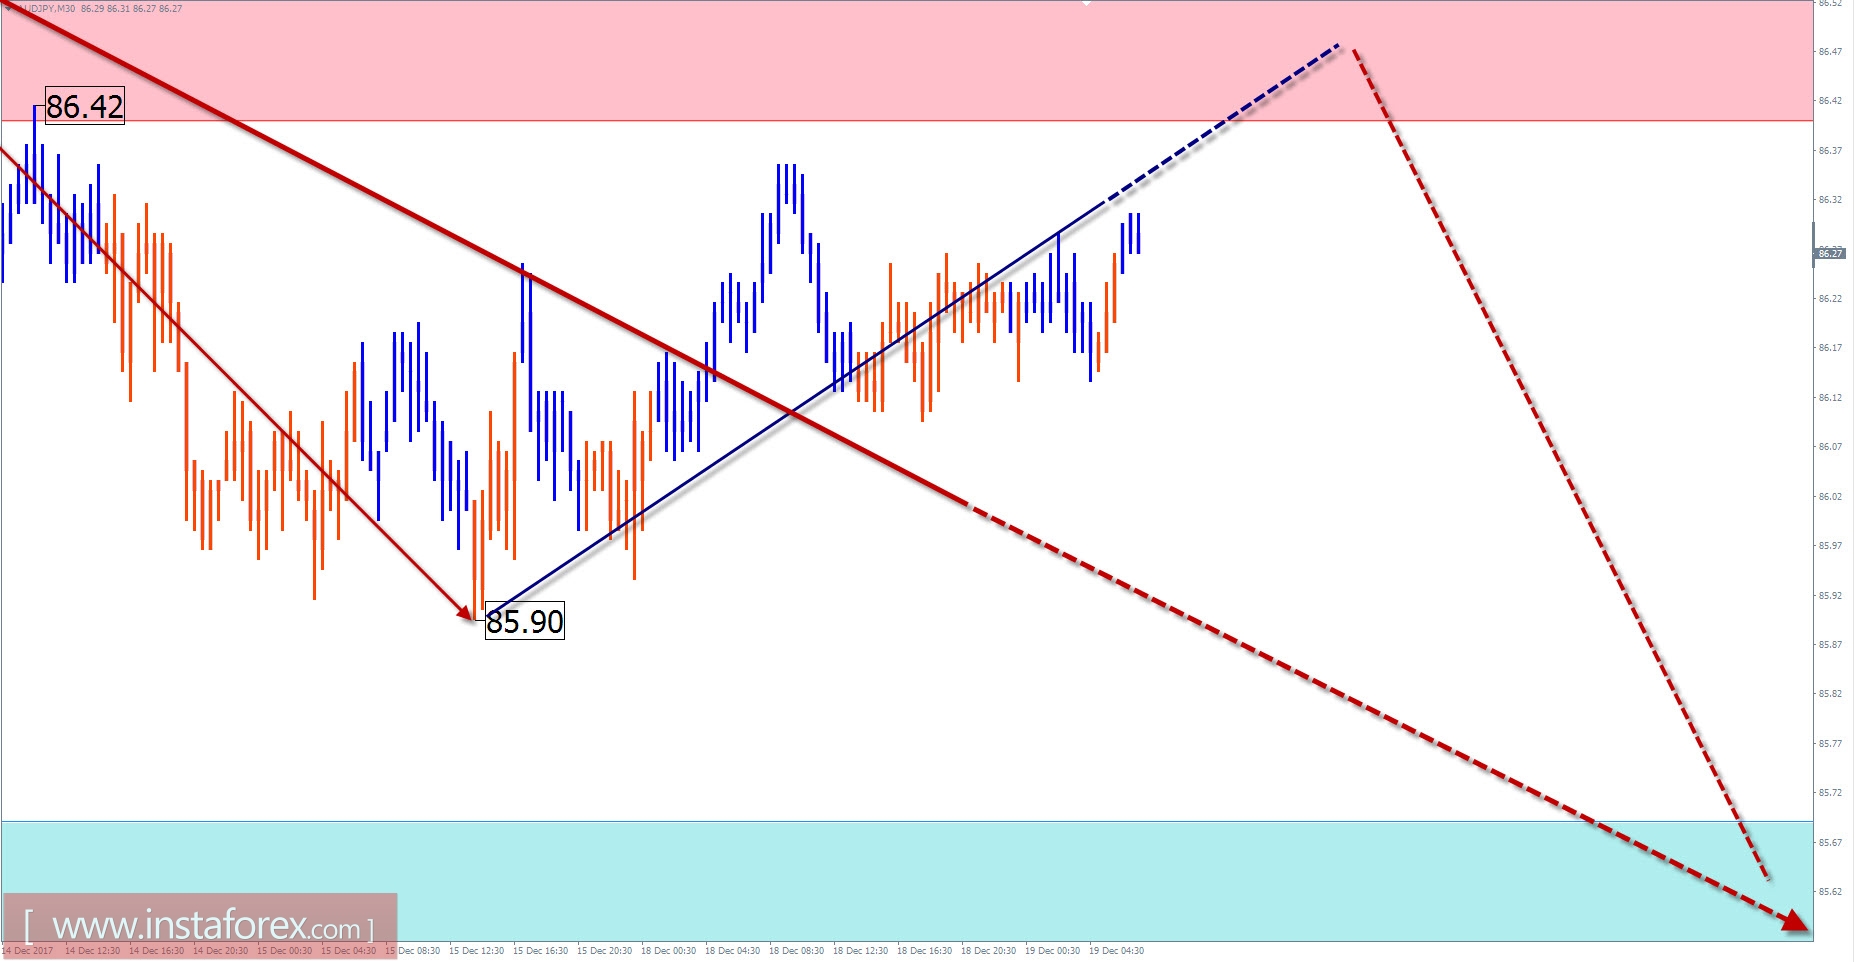
In the current year, the price movements of the cross pair, Australian dollar against the Japanese currency were broken off the main direction. Trend courses to the instrument were set by short-term waves. The last wave was launched on September 21. On the same day, the correctional part (B) was formed.
The wave has reached the minimum level of upward elongation. Since December 5th, a downward zigzag began to form which can give rise to a wave on a larger scale.
The upward movement is expected to end in the coming trading sessions. In the framework of the settlement zone, there are some changes in the exchange rate and the onset of the downward price trends are possible. Short-term flat at the upper limit of resistance cannot be ruled out. The active part of the descending phase is expected at the end of the day or tomorrow.
Boundaries of resistance zones:
- 86.40 / 70
Boundaries of support zones:
- 85.70 / 40
Explanations to the figures: For simplified wave analysis, a simple waveform is used that combines 3 parts (A; B; C). Of these waves, all kinds of correction are composed and most of the impulses. On each considered time frame the last and incomplete wave is analyzed.
The areas marked on the graphs are indicated by the calculation areas in which the probability of a change in the direction of motion is significantly increased. Arrows indicate the wave counting according to the technique used by the author. The solid background of the arrows indicates the structure formed, the dotted one indicates the expected wave motion.
Attention: The wave algorithm does not take into account the duration of the tool movements in time. The forecast is not a trading signal! To conduct a trade transaction, you need to confirm the signals of your trading systems.
* The presented market analysis is informative and does not constitute a guide to the transaction.


