Today is a weekend holiday for the markets, which allow a little contemplation on the prospects of the European currency.
Indicator "The Sequence of DeMark"
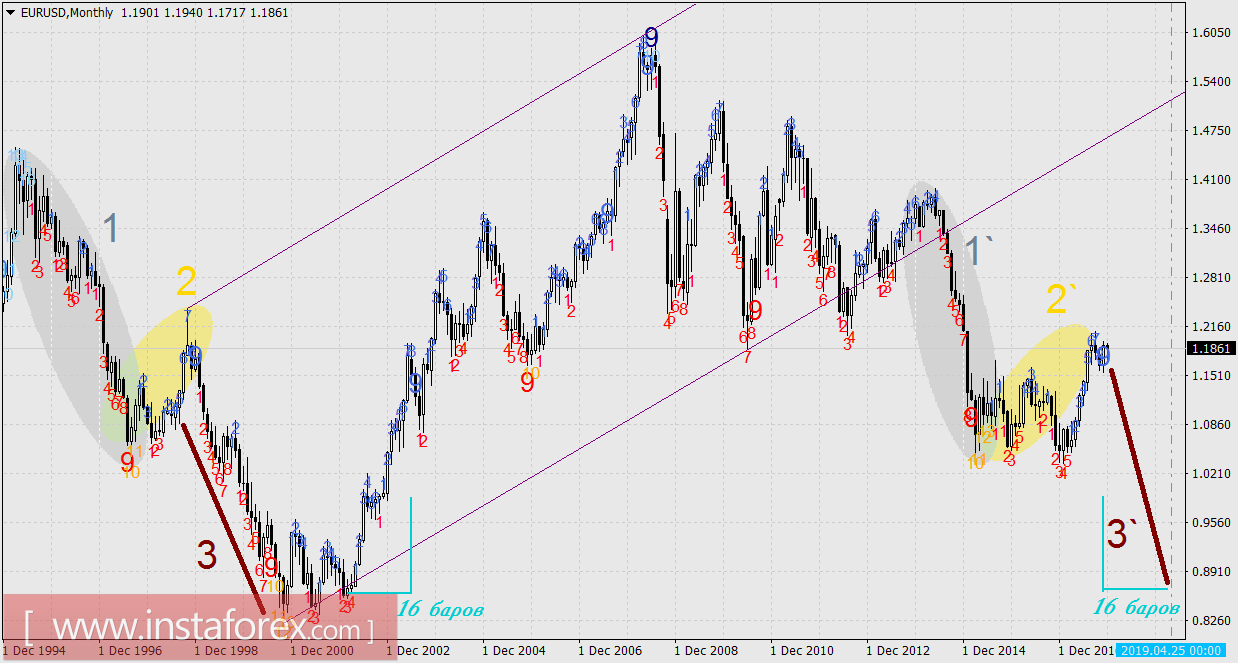
The Sequential indicator was invented by the classic of technical analysis, Thomas DeMark during the 80s. This indicator can predict periods of reversal and market depletion and further showed itself well in commodity markets which are cyclical in nature. This was put into use 5-8 years ago, the indicator accurately predicted a turn on the daytime when the commodity traded in 8 out of 10 cases. Later on, a shift to foreign exchange markets began and this indicator was forgotten, while others who did not work on these tools have completely different internal cycles. However, it was also proven that currency pairs are also well described by the sequential indicator, particularly the higher scales or monthly charts. As of this moment, this indicator shows the euro's turn in the long-term downward perspective, which completely coincides with the fundamental principles of this decline.
The idea of the indicator shows that after the ninth to thirteenth bar calculated by a special system, a trend reversal occurs.

So currently, we can see that the turn occurred exactly on the ninth bar. Definitely, the turn will not always occur after the ninth bar. But in this event, the report has gone again from one which means the trend will continue, as shown in September 2007 or even earlier in September 2003. Moreover, in order to gain a foothold in the opinion that the current pattern is correct, we will move into the depths of history. The coincident combination is visible in the period from April 1995 to December 1998. Earlier, during the years 1993-1997, the German stamp (synthetic euro) fell, this period is marked by a gray oval 1. The corresponding drop in 12-14 years is marked by a gray oval 1`. The rising correction is highlighted by a yellow oval 2. In our "modern" history, it lasted until the end of December this year (2`). Since January 1998, a two-year decline in the euro began, it is marked by a brown line of 3. And it is very likely that at least once a year (before the reversal of the "nine") the euro will fall, for instance, the entire 2018. If the decline lasted two years, then the whole pattern 1-2-3 will repeat almost exactly. The lower line of the lilac price channel cuts off the period of global market growth from the global decline, which began in May 2014 and the first branch of the decline.
A few lines.
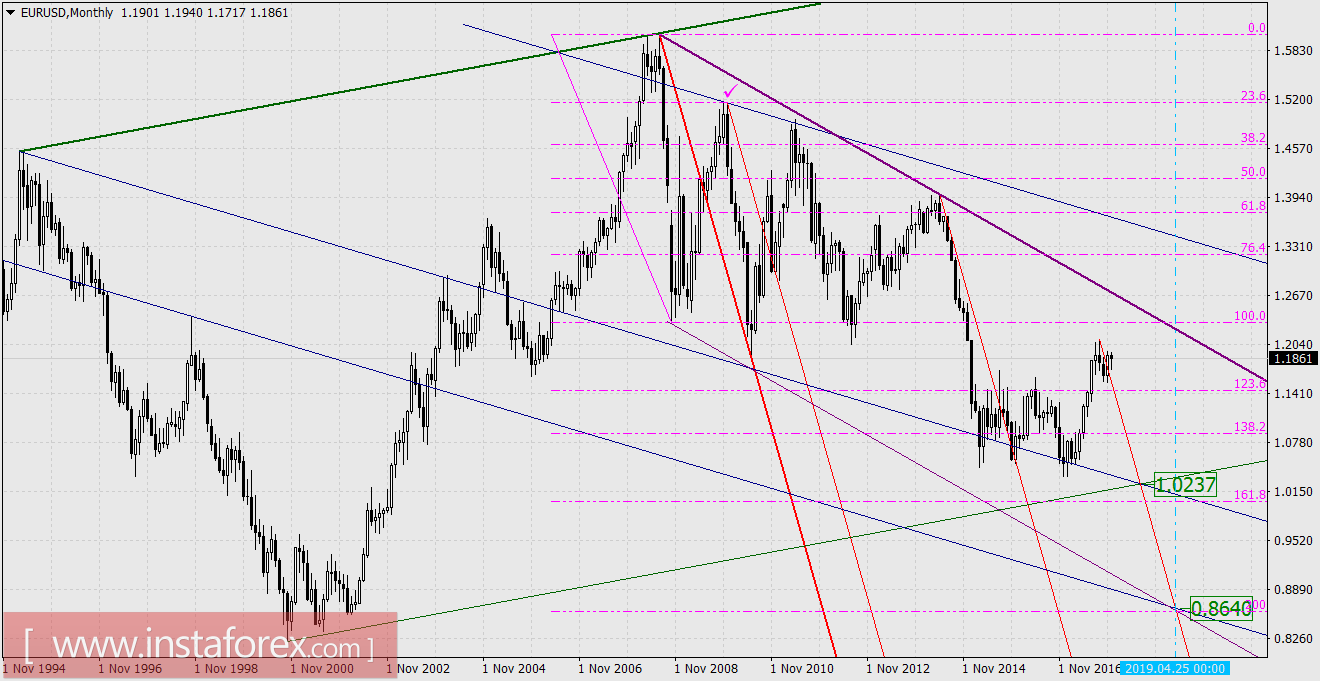
On the presented schedule, there is an attempt to determine the exact target levels of the forthcoming euro decline.

The idea in this chart is simple. With the help of non-traditional ways of building price channels, it needs to identify the magnetic points of the price, if any. Thick lines of different colors are the basic lines, from which parallel lines of the same color line up to the extremes of the price. There are two such points shown at the level of 1.0237 (July 2018) and 0.8640 (April 2019). Usually, one of the two points passes "by", but in general, there would be a resulting downward trend at a near-crisis pace. On the other hand, there is nothing surprising in the strong decline, the five-month uncontrollable growth of the euro in the spring-summer of 2017 is almost more perplexing, almost on speculations with even greater speed. Also, for this reason, the excessive price growth should descend to the "intended" levels as quickly as possible. The time required to reach the second target at 0.8640, takes 16 months, which exactly coincides with the time period of growth to the ninth bar, according to the Sequential indicator from February 2002 to June 2003. Therefore, we will wait for the price in April 2019.
* The presented market analysis is informative and does not constitute a guide to the transaction.


