


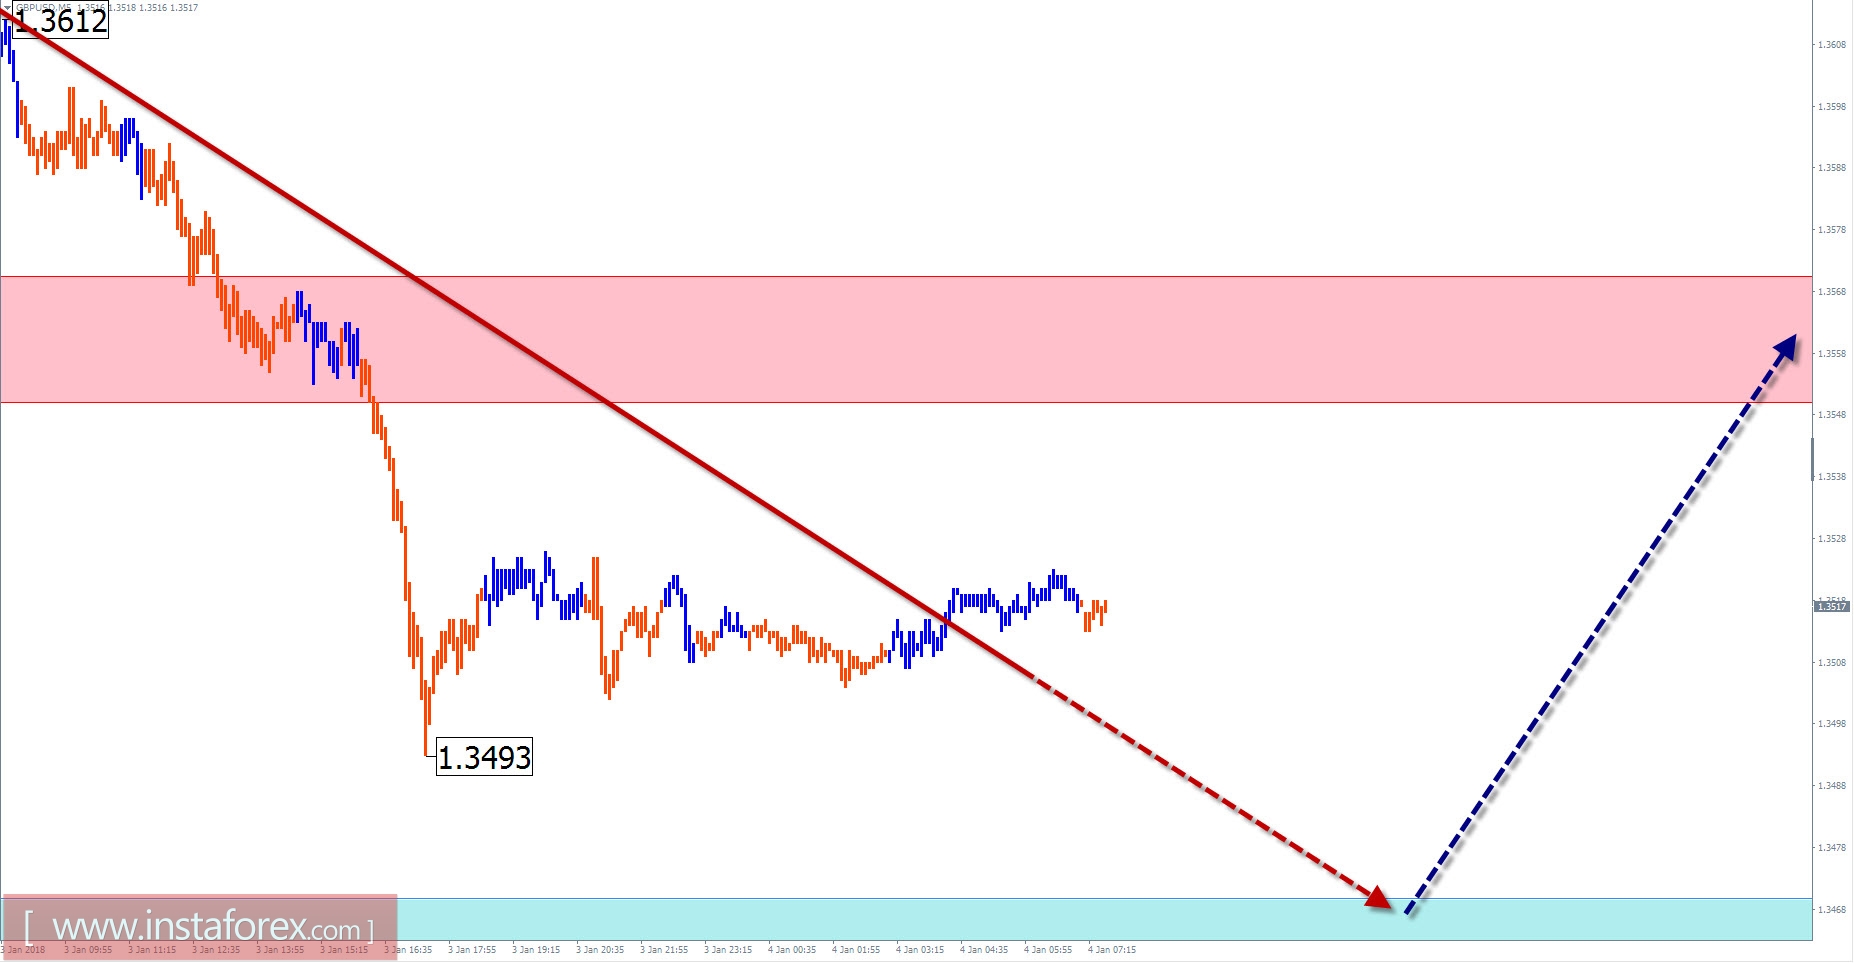
Review and forecast for GBP / USD
As a result of the formation of a bullish correction on the daily scale of the British pound major pair on the chart, the price climbed to the lower boundary of the preliminary target zone. At the end of the wave from the middle of September last year, a downward wave of a smaller scale is developing. Its high wave level indicates the early onset of the oncoming traffic. The bearish wave should form at least a correction of the previous rise.
In the structure of the incomplete descending wave, the middle part of the structure (B) is nearing completion.
Today, there is a high chance for a flat movement with a descending vector and rollback will most likely get completed in the support zone. At the end of the day, the chance of a return to the upward movement of the price will increase.
Boundaries of resistance zones:
- 1.3550 / 80
Boundaries of support zones:
- 1.3470 / 40
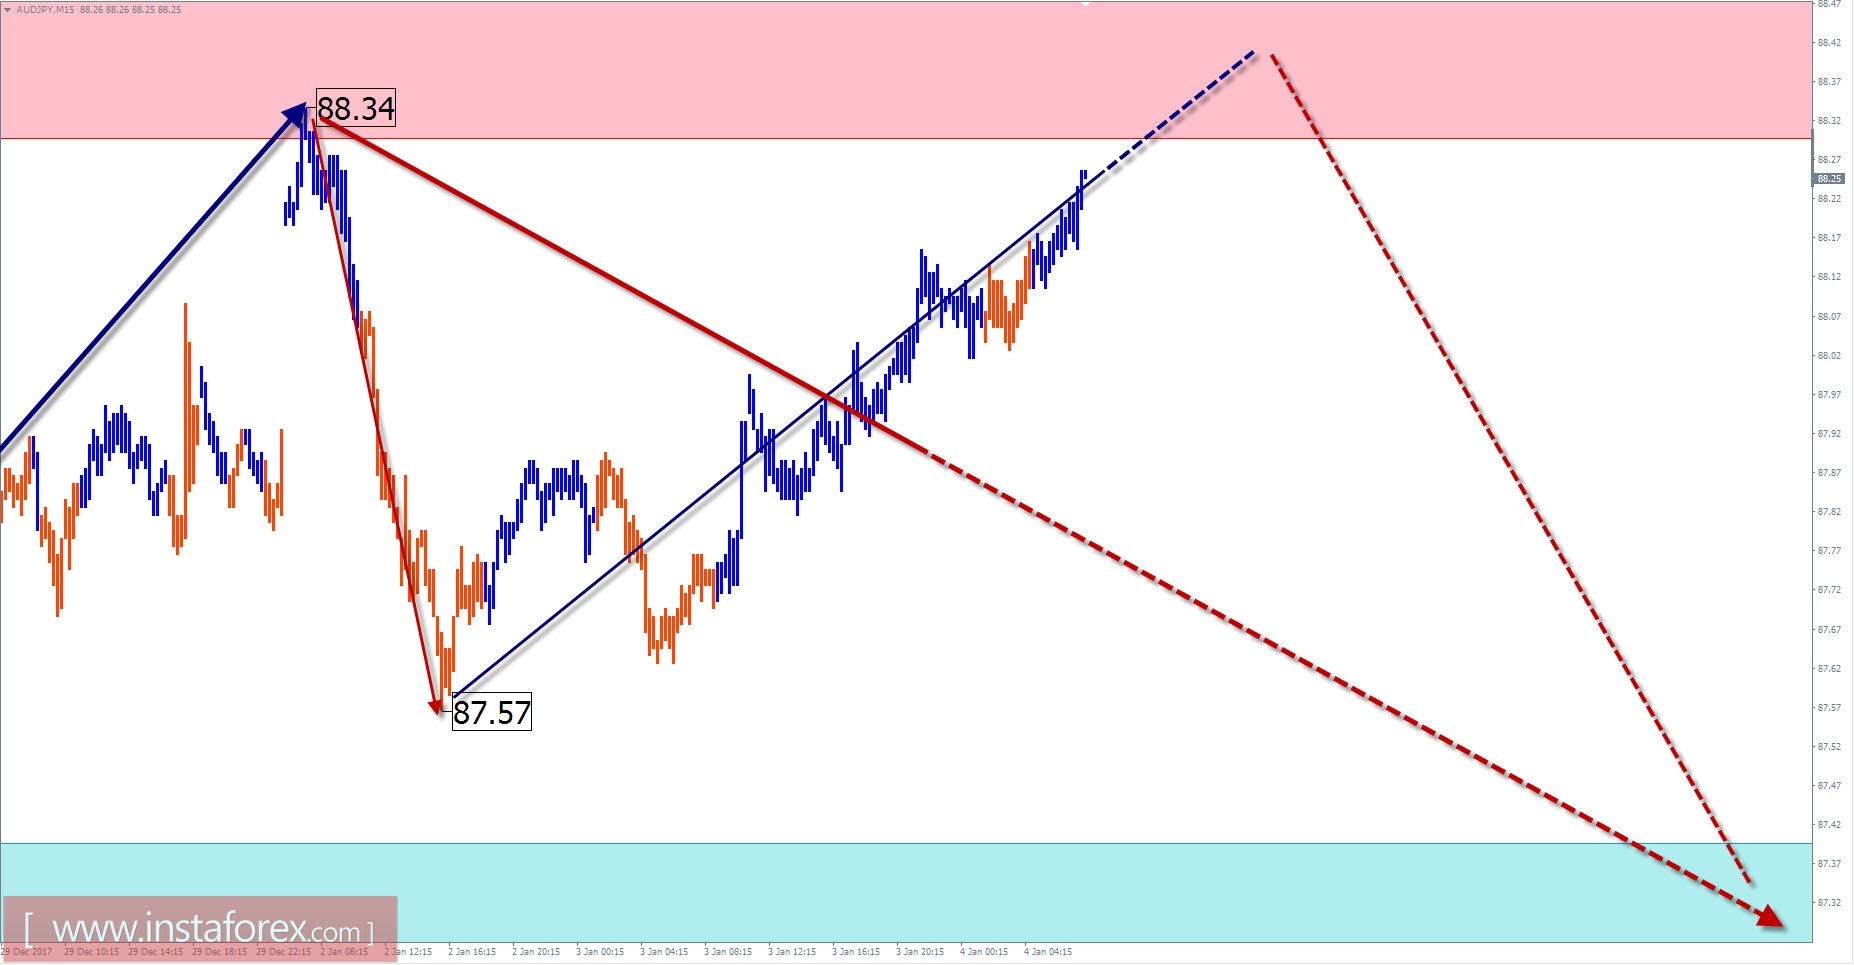
Review and Forecast for AUD / JPY
The direction of the main trend in the short term on the cross chart since June 2016 is set by a bull wave. The closest zone of the potential turn is the plot of the graph in the area of local high last September.
After the autumn price correction from the beginning of December, the quotes began to form a wave in the dominant direction. At the present time, the lower boundary of the preliminary target zone has been reached. The internal structure of the ascending section of the graph has not yet been completed, which indicates that there is no correction formed from this level with the subsequent continuation of the upward wave formation.
In the next sessions, an inter-sessional trend is expected to change. The formation of the turn is most likely within the resistance zone while the lower boundary of the day course of the pair ranges in the support zone.
Boundaries of resistance zones:
- 88.30 / 60
Boundaries of support zones:
- 87.40 / 10
Explanations of the figures:
For simplified wave analysis, a simple waveform is used that combines 3 parts namely A, B, and C. All types of correction are created and most of the impulses can be found in these waves. Every time frame is considered and the last incomplete wave is analyzed.
The areas marked on the graphs indicate the probability of a change in the direction of motion has significantly increased as calculated in the areas. Arrows indicate the wave counting following the technique used by the author. A solid background of the arrows signifying the structure has been formed while the dotted one means the expected wave motion.
Attention: The wave algorithm does not take into account the duration of the movement of tools in time. The forecast is not a trading signal! To conduct a bargain, you need to confirm the signals used by your trading systems.


