


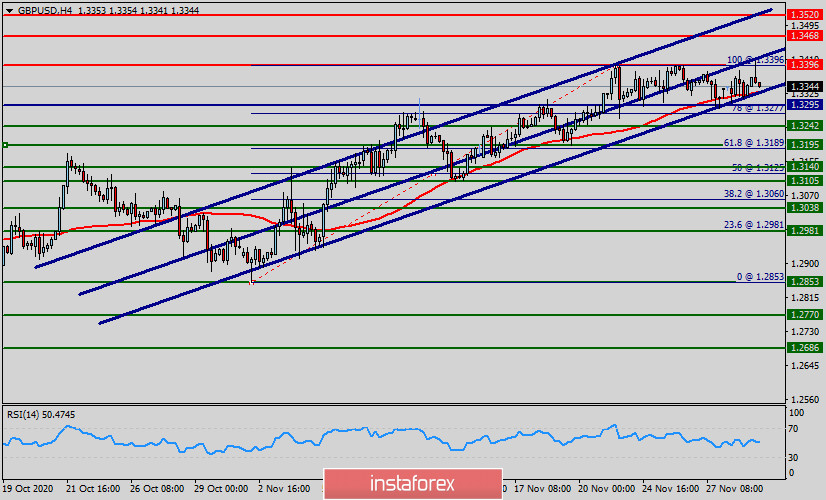
On the H4 chart, the chart shows an uptrend channel since last week. The currently price is set at 1.3352. The daily pivot point had already placed at the point of 1.3295.
The GBP/USD pair will continue to rise from the level of 1.3295 in the long term. It should be noted that the support is established at the level of 1.3295 which represents the 50% Fibonacci retracement level on the H4 chart. The price is likely to form a double bottom in the same time frame.
Accordingly, the GBP/USD pair is showing signs of strength following a breakout of the highest level of 1.3350.
So, buy above the level of 1.3350 with the first target at 1.3396 in order to test the daily resistance 1 and further to 1.3396. Also, it might be noted that the level of 1.3396 is a good place to take profit because it will form a new double top.
This suggests the pair will probably go up in coming hours. Additionally, the price is in a bullish channel now. Amid the previous events, the pair is still in an uptrend. From this point, the GBP/USD pair is continuing in a bullish trend from the new resistance of 1.3396.
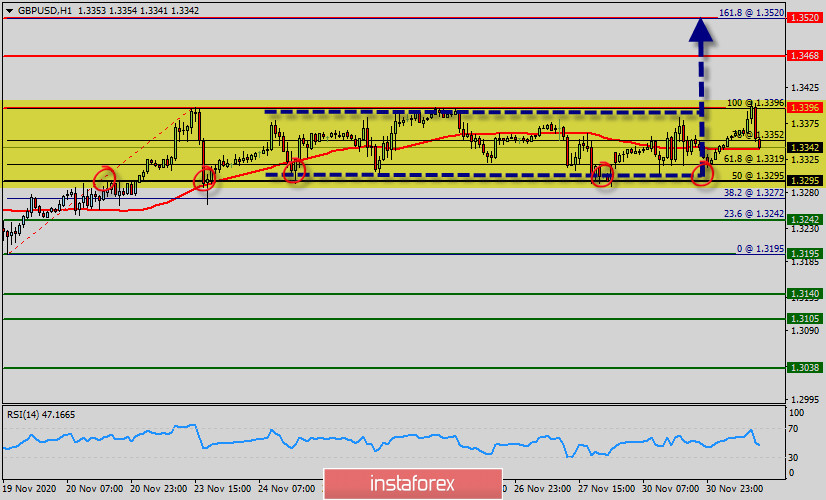
On the H1 chart, the trend of GBP/USD pair movement was controversial as it took place in a narrow sideways channel, the market showed signs of instability.
Amid the previous events, the price is still moving between the levels of 1.3295 and 1.3469.
The daily resistance and support are seen at the levels of 1.3396 and 1.3295 respectively.
Therefore, it is recommended to be cautious while placing orders in this area. So, we need to wait until the sideways channel has completed.
The market will be moving from its bottom at 1.3295 so as to continue to rise towards the top of 1.3396.
The GBP/USD pair broke resistance which turned to strong support at the level of 1.3295. The level of 1.3295 coincides with a ratio of50% of Fibonacci, which is expected to act as major support today.
The Relative Strength Index (RSI) is considered overbought because it is above 30. The RSI is still signaling that the trend is upward as it is still strong above the moving average (100). This suggests the pair will probably go up in coming hours.
Accordingly, the market is likely to show signs of a bullish trend. In other words, buy orders are recommended above 1.3350 with the first target at the level of 13396. From this point, the pair is likely to begin an ascending movement to the point of 13396 and further to the level of 1.3468. The level of 1.3468 will act as strong resistance. The third resistance has alreadt palced at 1.3520.
On the contrary, in case a reversal takes place and the GBP/USD pair breaks through the support level of 1.3242, a further decline to 1.3140 can occur which would indicate a bearish market.


