Gold price continues to bounce and threatens bears to change short-term trend to bullish. Gold price has broken above short-term resistance levels and is now challenging the Ichimoku cloud (Kumo) at $1,830.
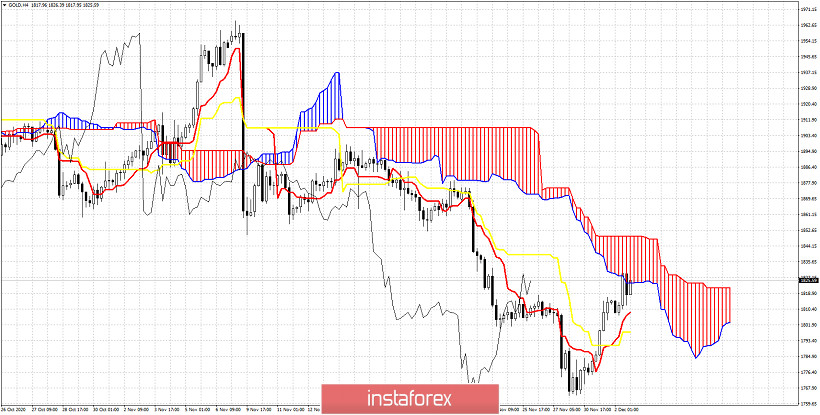
Price is above the tenkan-sen (red line indicator) and the kijun-sen (yellow line indicator). This gives hopes to bulls for a trend change. However price is still below the Kumo (cloud). A rejection here would be a bearish sign. If someone wants to go short this is the time. Near important resistance levels. Gold price is challenging the cloud from below. If a rejection is combined with a price break below $1,797 (kijun-sen yellow line indicator) then we should expect to see new lows in Gold towards $1,750-25.
Gold price will need to break above $1,850 and stay above the Kumo (cloud) in order for trend to change to bullish again. Remember that $1,850 was the key support on the way down. Now it is resistance.


