


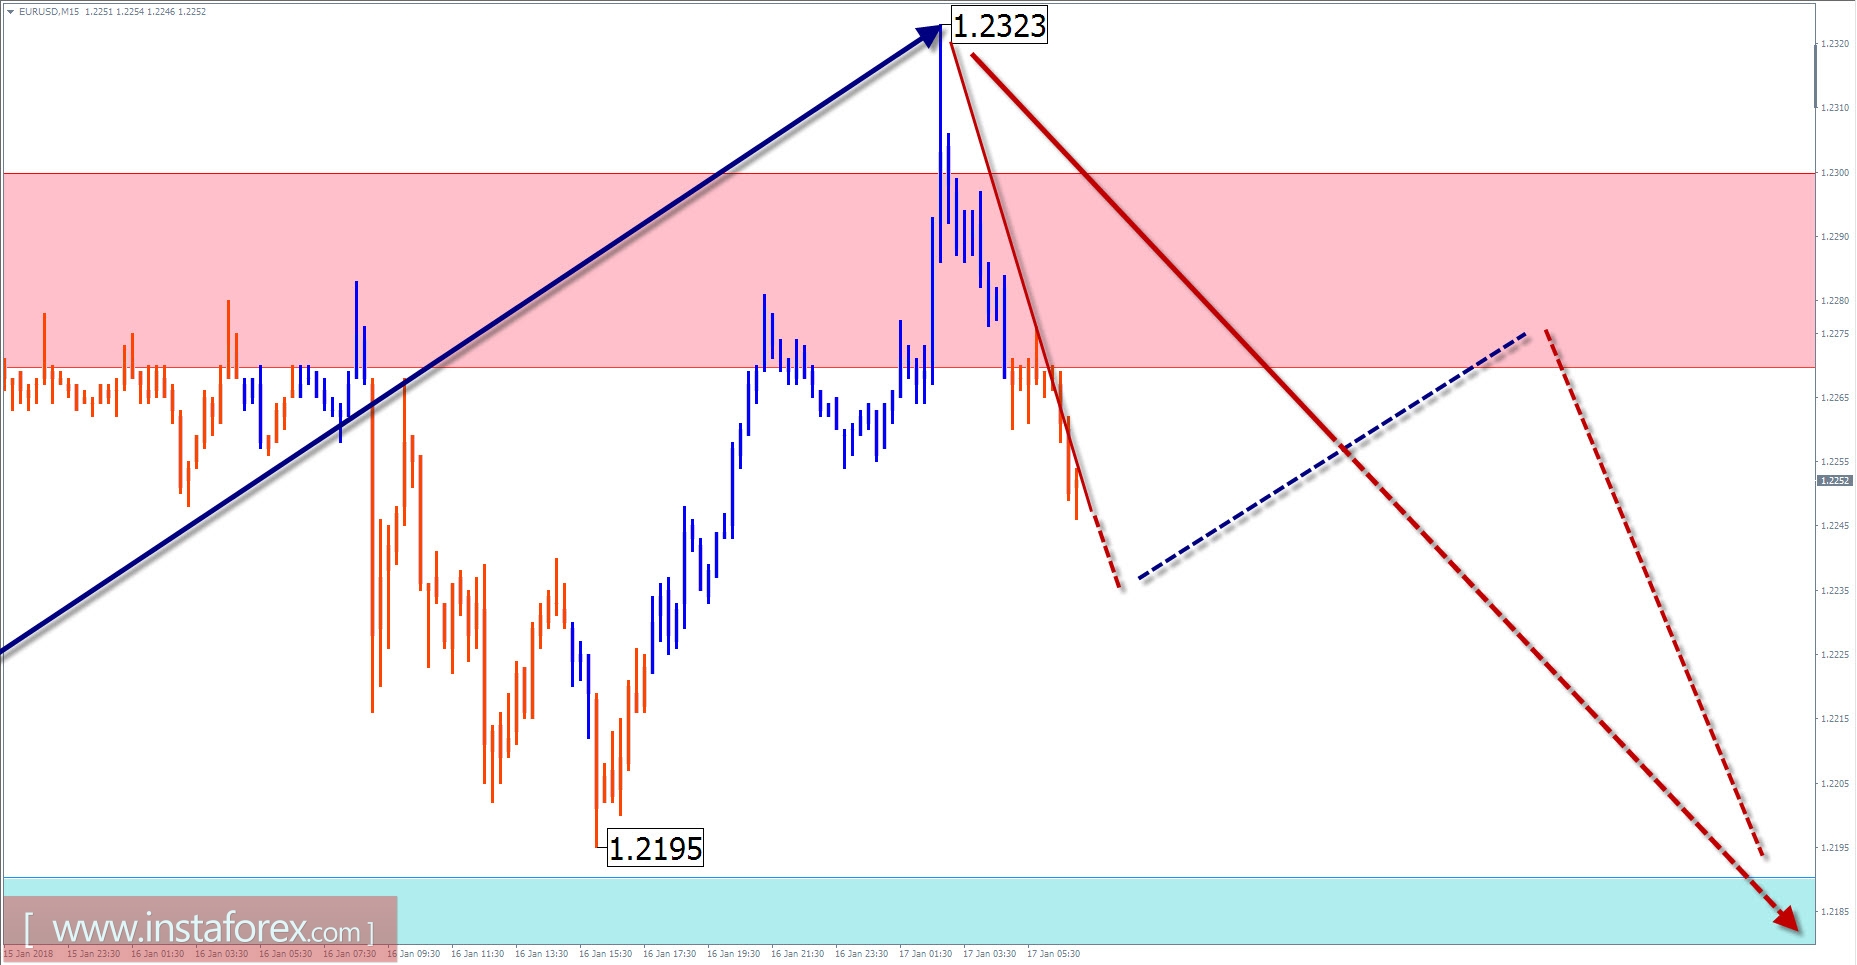
Overview and forecast for EUR / USD
The chart of the major pair of European currency entered the potential reversal zone, backed up by the resistance level on a large scale. Despite the incompleteness of the current ascending expanded flat, the probability of the pair's corrective movement in the coming days had significantly increased. There is a high possibility for the decrease in the rate of pair with the prevailing flat nature of fluctuations.
On the next 24 hours, the forming conditions for changing the trend direction and the beginning of a price reduction are expected. The range of oscillations for today is unlikely to exceed the boundaries of the calculated zones.
Boundaries of resistance zones:
- 1.2270 / 1.2300
Boundaries of support zones:
- 1.2190 / 60
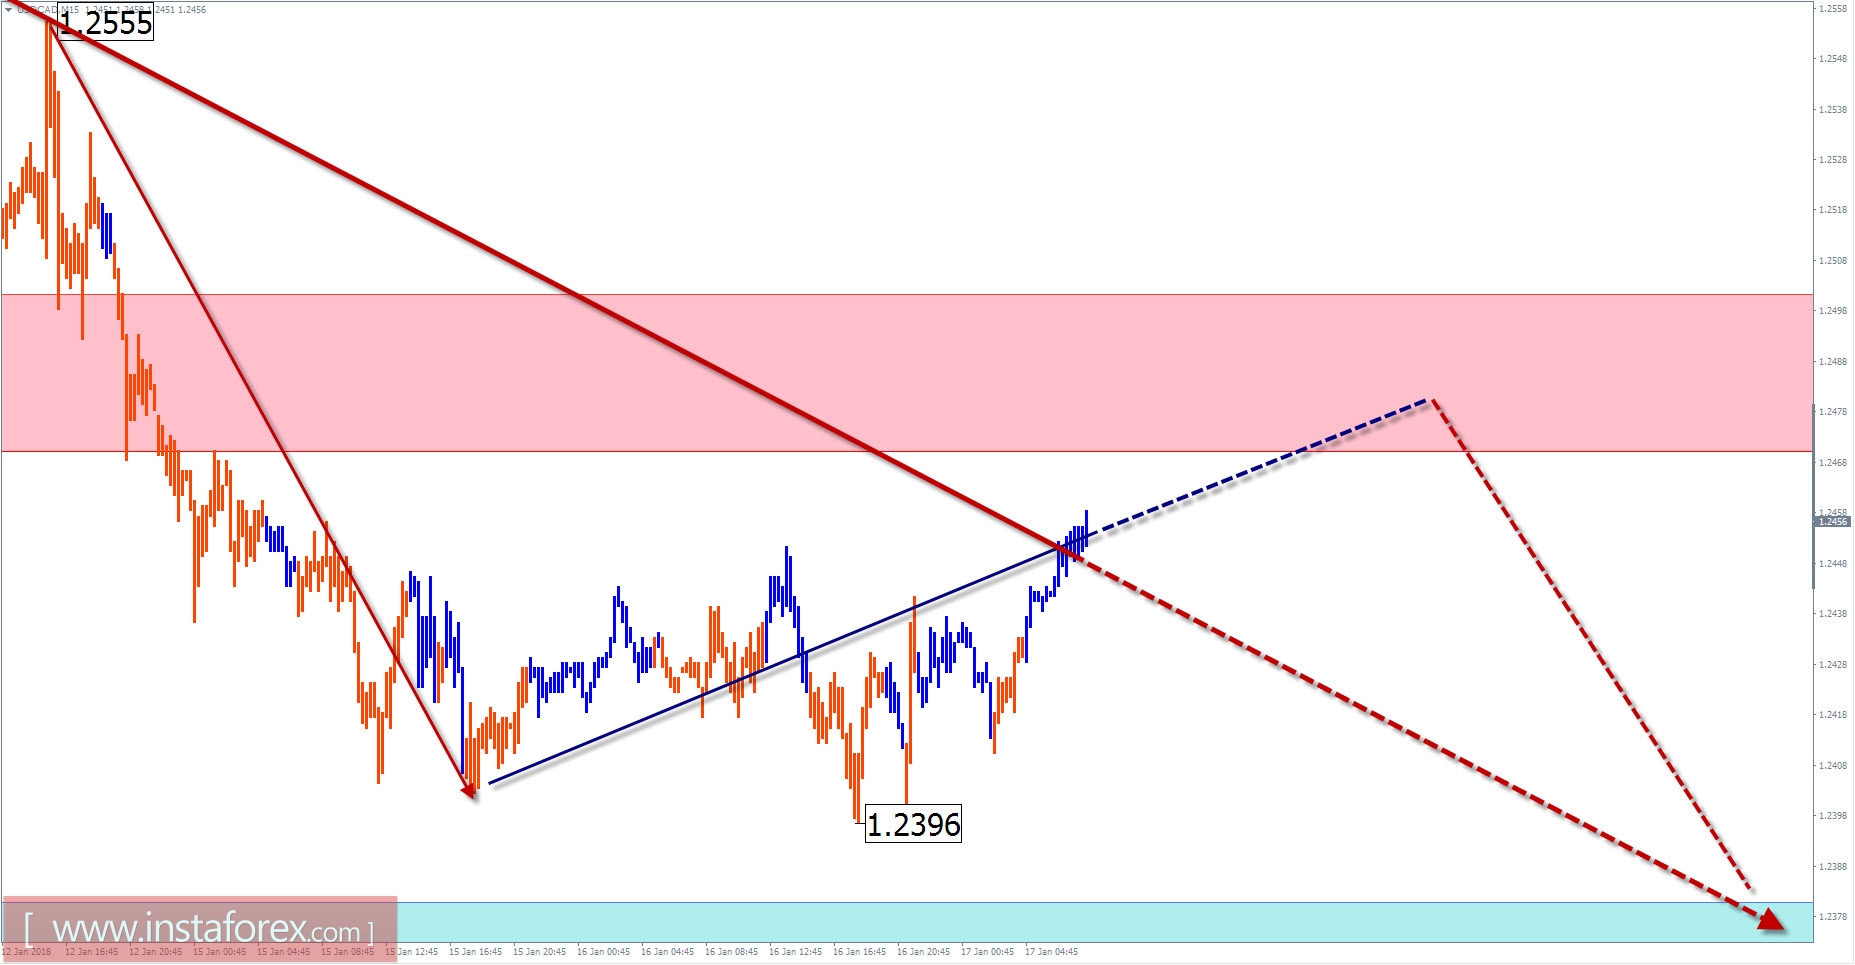
Review and forecast for USD / CAD
In analyzing the wave pattern chart of the major pair Canadian dollar in the short-term timeframe scale, an unfinished bear wave from May 5 last year prevailed. In the structure of the wave, the correction area worked out. In late October, it was replaced by a new segment of the trend direction. In turn, the counter correction section worked out at the beginning of the current month. Since January 10, it can be said that the beginning of the formation for the new downward wave zigzag.
Today, the highly expected scenario of the movement will be "outset". In the morning, short-term price pressure on the upper boundary of the resistance zone is not ruled out. By the end of the day, a return to the main direction of the price movement is expected.
Boundaries of resistance zones:
- 1.2470 / 1.2500
Boundaries of support zones:
- 1.2380 / 50
Explanations to the figures: For simplified wave analysis, a simple waveform is used that combines 3 parts (A; B; C). Of these waves, all kinds of correction are composed and most of the impulses. On each considered time frame the last and incomplete wave is analyzed.
The areas marked on the graphs are indicated by the calculation areas in which the probability of a change in the direction of motion is significantly increased. Arrows indicate the wave counting according to the technique used by the author. The solid background of the arrows indicates the structure formed, the dotted one indicates the expected wave motion.
Attention: The wave algorithm does not take into account the duration of the tool movements in time. The forecast is not a trading signal! To conduct a trade transaction, you need to confirm the signals of your trading systems.
* The presented market analysis is informative and does not constitute a guide to the transaction.


