


Overview and forecast for EUR / USD
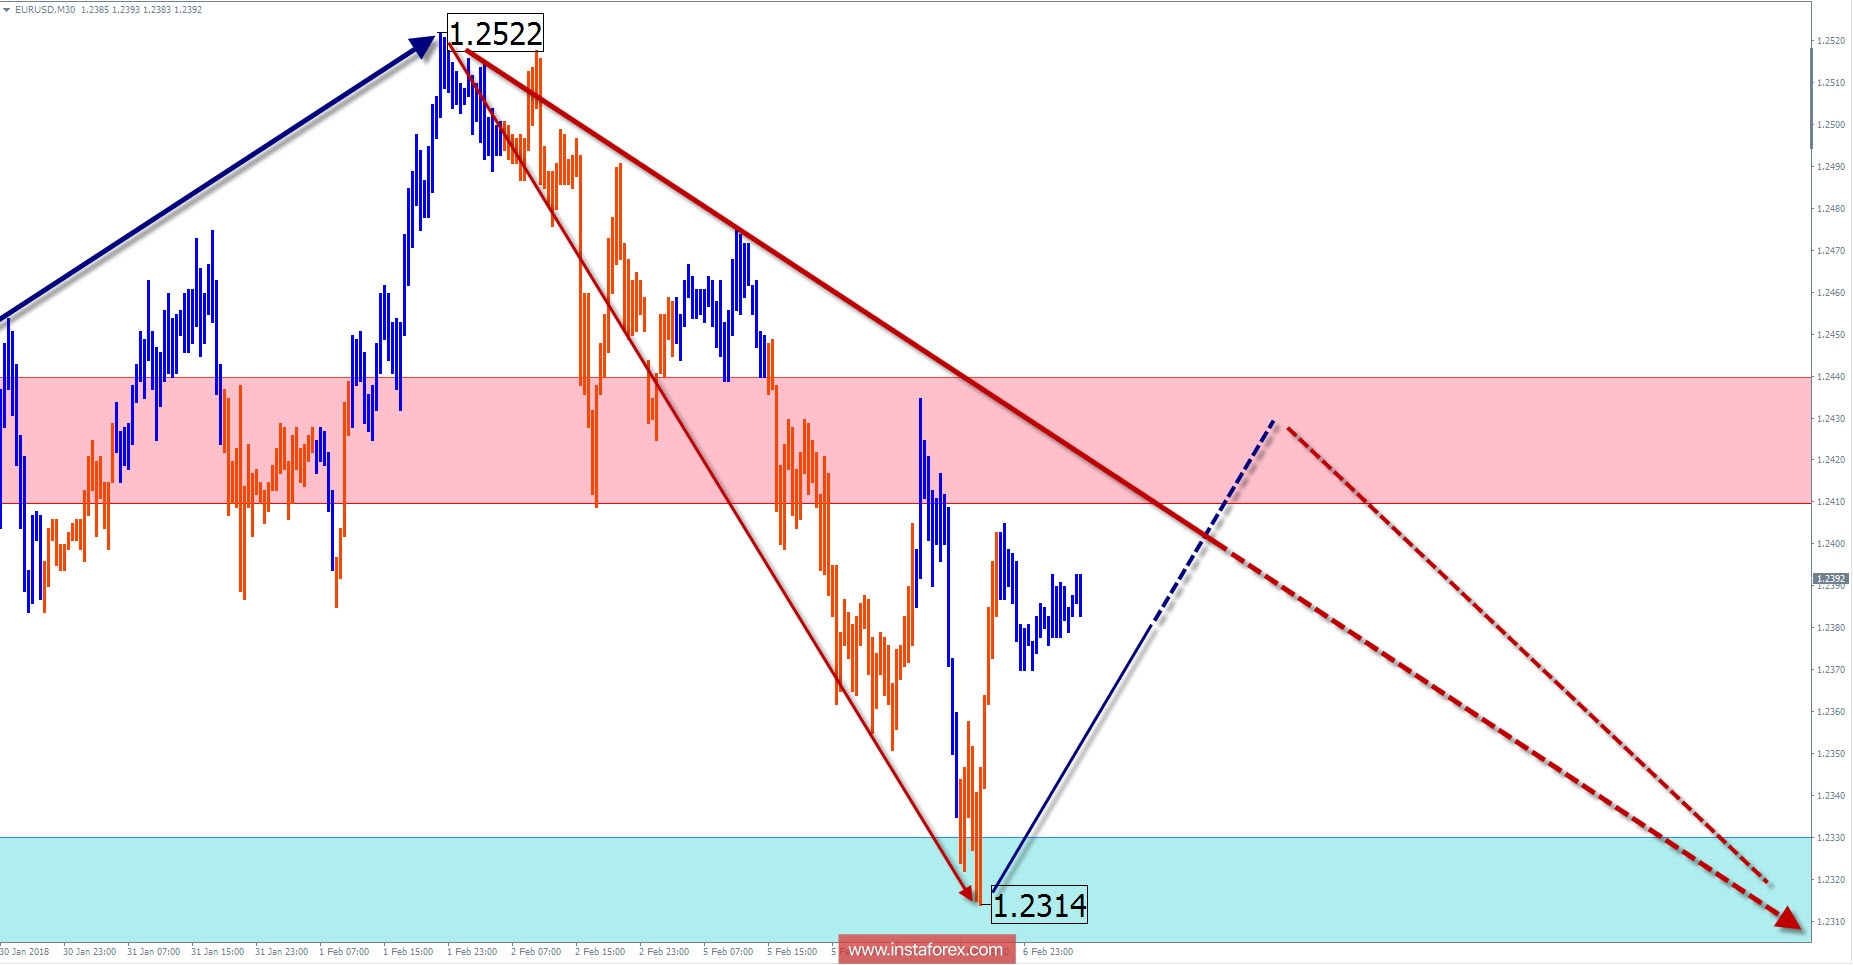
The upward expanded flat formed on the chart of the major pair EUR/USD and led the quotations to the lower boundary of the strong potential reversal zone. Despite the fact that the structure of the entire main wave does not show completeness, the continuation of the intermediate correction can be expected at the current price levels in the near future.Analysis of the last downward wave indicates a preliminary benchmark for the possible decline near the 121st price figure. With the generally flat nature of price movement in the past weeks, the final section may have the form of impulse price that shoots through.
Today, we expect a common flat tone of the pair's fluctuations. In the first half of the day, a reversal and the beginning of a decline are expected within the framework of the calculated resistance.
Boundaries of resistance zones:
- 1.2410 / 40
Boundaries of support zones:
- 1.2330 / 1.2300
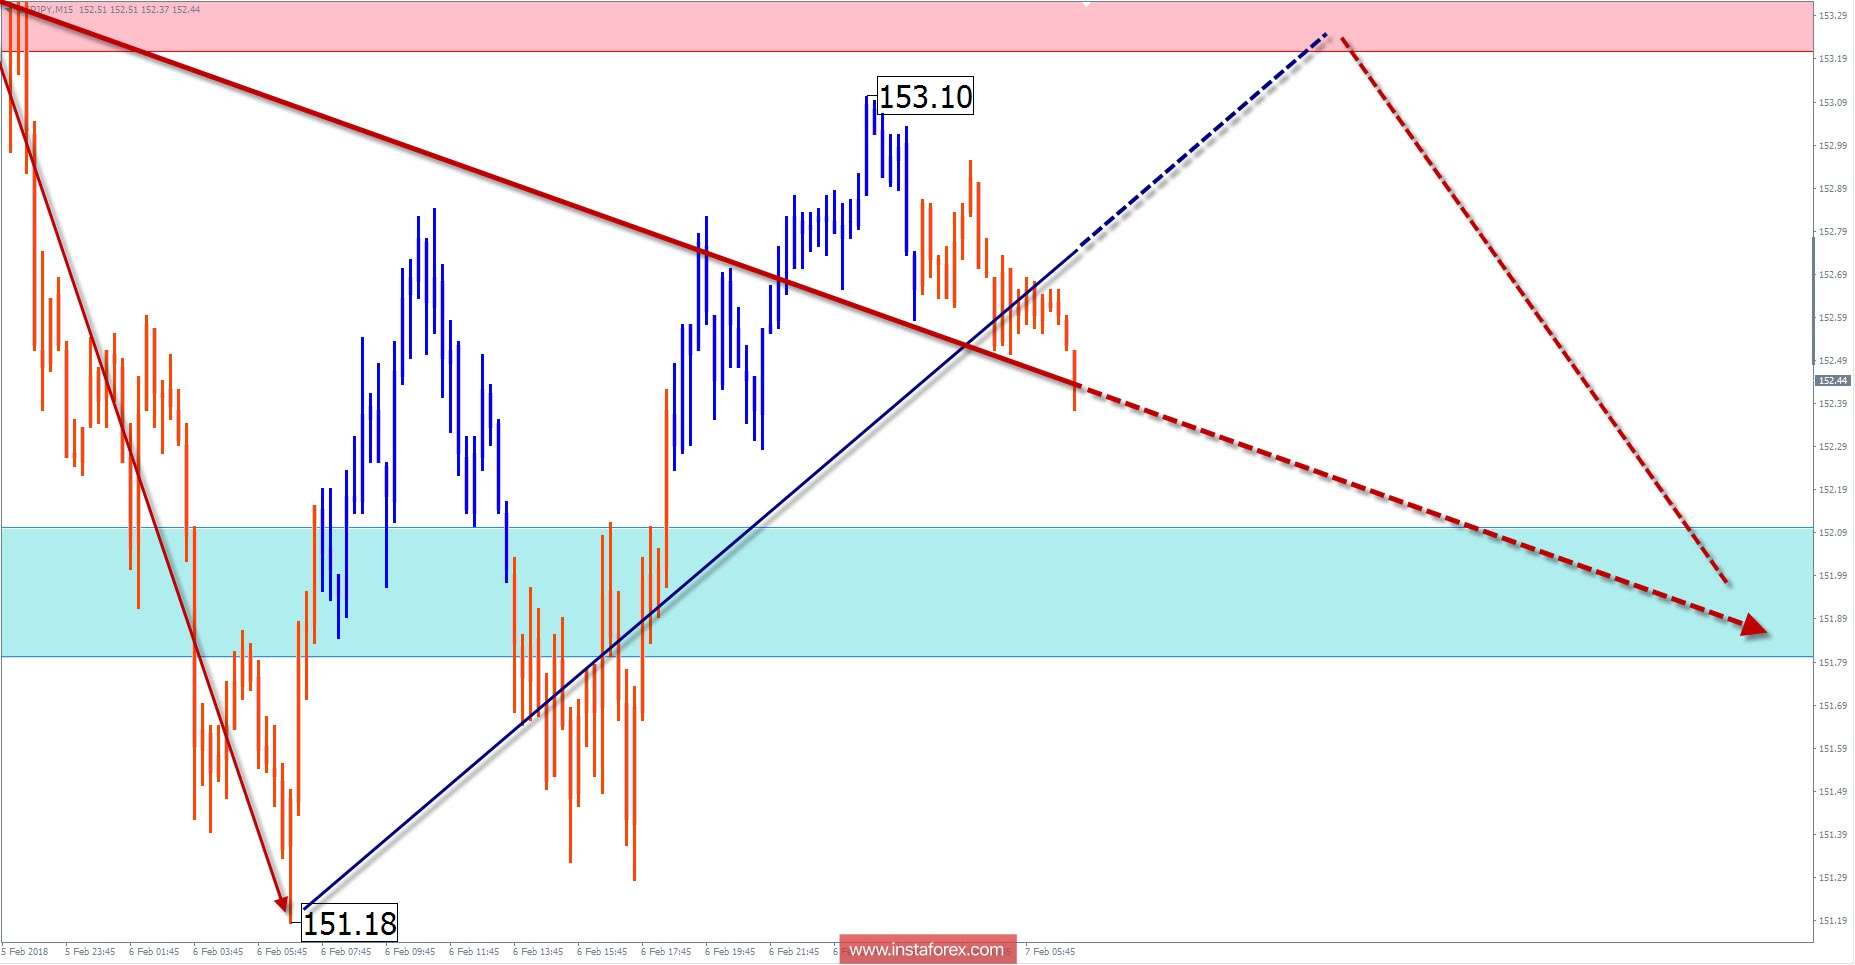
Review and Forecast for GBP / JPY
The prevailing trend on the chart of the cross pair since October 2016 is set by the ascending wave. Price extremes formed a geometric figure "ascending pennant", the upper end of which lies against the strong potential reversal zone.
Since September last year, descending wave of small-scale began to form at the end of the trend wave. The kind of its structure is an irregular shape which lacks the final section. The preliminary calculation of the target zone gives a reference point in the region of 5 price figures from the current exchange rate of the pair.
After a possible short-term growth of the rate at the nearest session, the pair's price is expected to reverse and move down. The lower limit of the daily range is the calculated support.
Boundaries of resistance zones:
- 153.20 / 50
Boundaries of support zones:
- 152.10 / 151.80
Explanations to the figures: For simplified wave analysis, the simplest type of wave is used in the form of a zigzag, combining 3 parts (A; B; C). Of these waves, all kinds of correction are composed and most of the impulses. At each time frame, the last, incomplete wave is analyzed.
The areas marked on the graphs are indicated by the calculation areas, where the probability of a change in the direction of motion is significantly increased. Arrows indicate the wave counting according to the technique used by the author. The solid background of the arrows indicates the structure formed, the dotted one indicates the expected wave motion.
Attention: The wave algorithm does not take into account the duration of the tool movements in time. The forecast is not a trading signal! To conduct a trade transaction, you need to confirm the signals of your trading systems.
* The presented market analysis is informative and does not constitute a guide to the transaction.


