


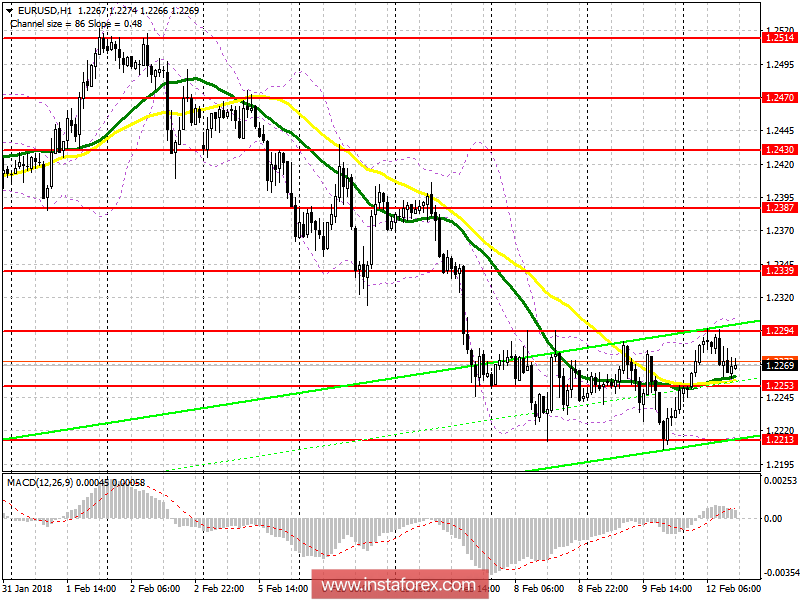
EUR / USD pair
To open long positions for EUR / USD pair, you need:
It is best to consider new long positions after updating the first intermediate level of support located in the area of 1.2253, or after the EUR / USD declined and the weekly low test at the level of 1.2213. Fastening above the level of 1.2294 will also be a good signal to buy the euro with the expectation of an update of 1.2339, where fixing profits are recommended.
To open short positions for EUR / USD pair, you need:
While the trade is below the level of 1.2294, we can expect further a decline in the euro in order to update the level of 1.2253 and the main goal of reaching the weekly low in the area of 1.2213, where fixing profits are recommended.
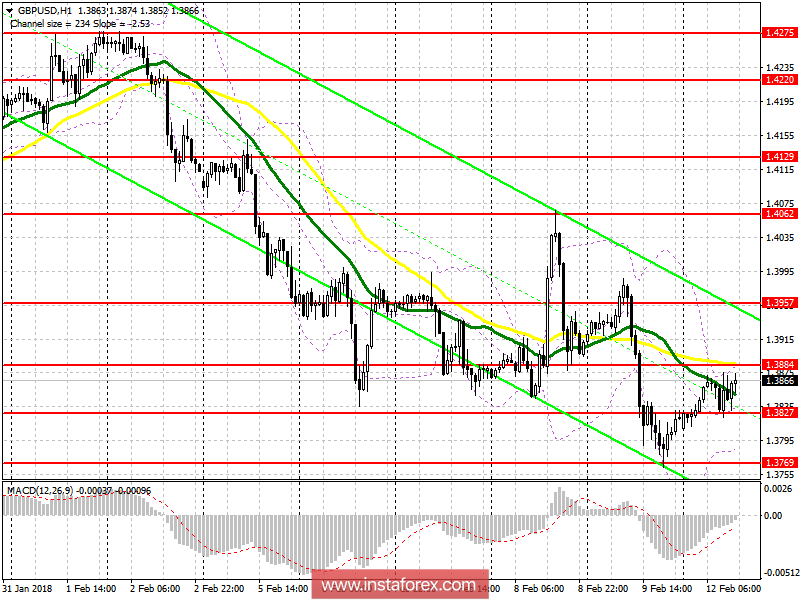
GBP / USD pair
To open long positions for GBP / USD pair, you need:
While trading above the level of 1.3827, a corrective recovery of the GBP / USD pair is expected through a breakout and consolidation above 1.3884 will be an additional signal to increase long positions of the pound, aiming to reach the level of 1.3957, where fixing profits are recommended. In case of a return below the level of 1.3827, you can buy a pound for a rebound from 1.3769.
To open short positions for GBP / USD pair you need:
The formation of a false breakout at the level of 1.3884 with a return to this level will be another signal to sell the pound with the key goal of a breakdown and consolidation below 1.3827. After which, it will be possible to count on reaching the low of last week's level to 1.3769, where fixing profits are recommended. Otherwise, you can sell the pound immediately for a rebound from 1.3957.
To familiarize with the basic concepts and the general rules of my TS is possible here.
Indicators description
- MA (average sliding) 50 days - yellow
- MA (average sliding) 30 days - green
- MACD: fast EMA 12, slow EMA 26, SMA
- Bollinger Bands 20


