


Overview and forecast for GBP / USD
The direction of the price movement of the main pair of the British pound is set by the rising wave of October 10, 2016. In a larger wave formation, this section does not go beyond correction. Nevertheless, the preliminary zone for the completion of the wave is passed at a price, which indicates the continuation of the trend. In favor of this scenario says the absence of signals of a turn and formation of a hidden bearish wave of a smaller scale at the end of the current movement. The waves of this kind do not have a reversal potential, preceding a new wave of the trend.
The descending wave of January 25 develops in the form of a flat zigzag. The preliminary calculation indicates the zone of the probable completion of the entire wave region of the 136th price figure.
Today, price fluctuations of the pair are expected within the limits of the counter settlement zones. The descending vector of motion is more likely in the second half of the day.
The boundaries of resistance zones:
- 1.4020 / 50
The boundaries of support zones:
- 1.3930 / 1.3900

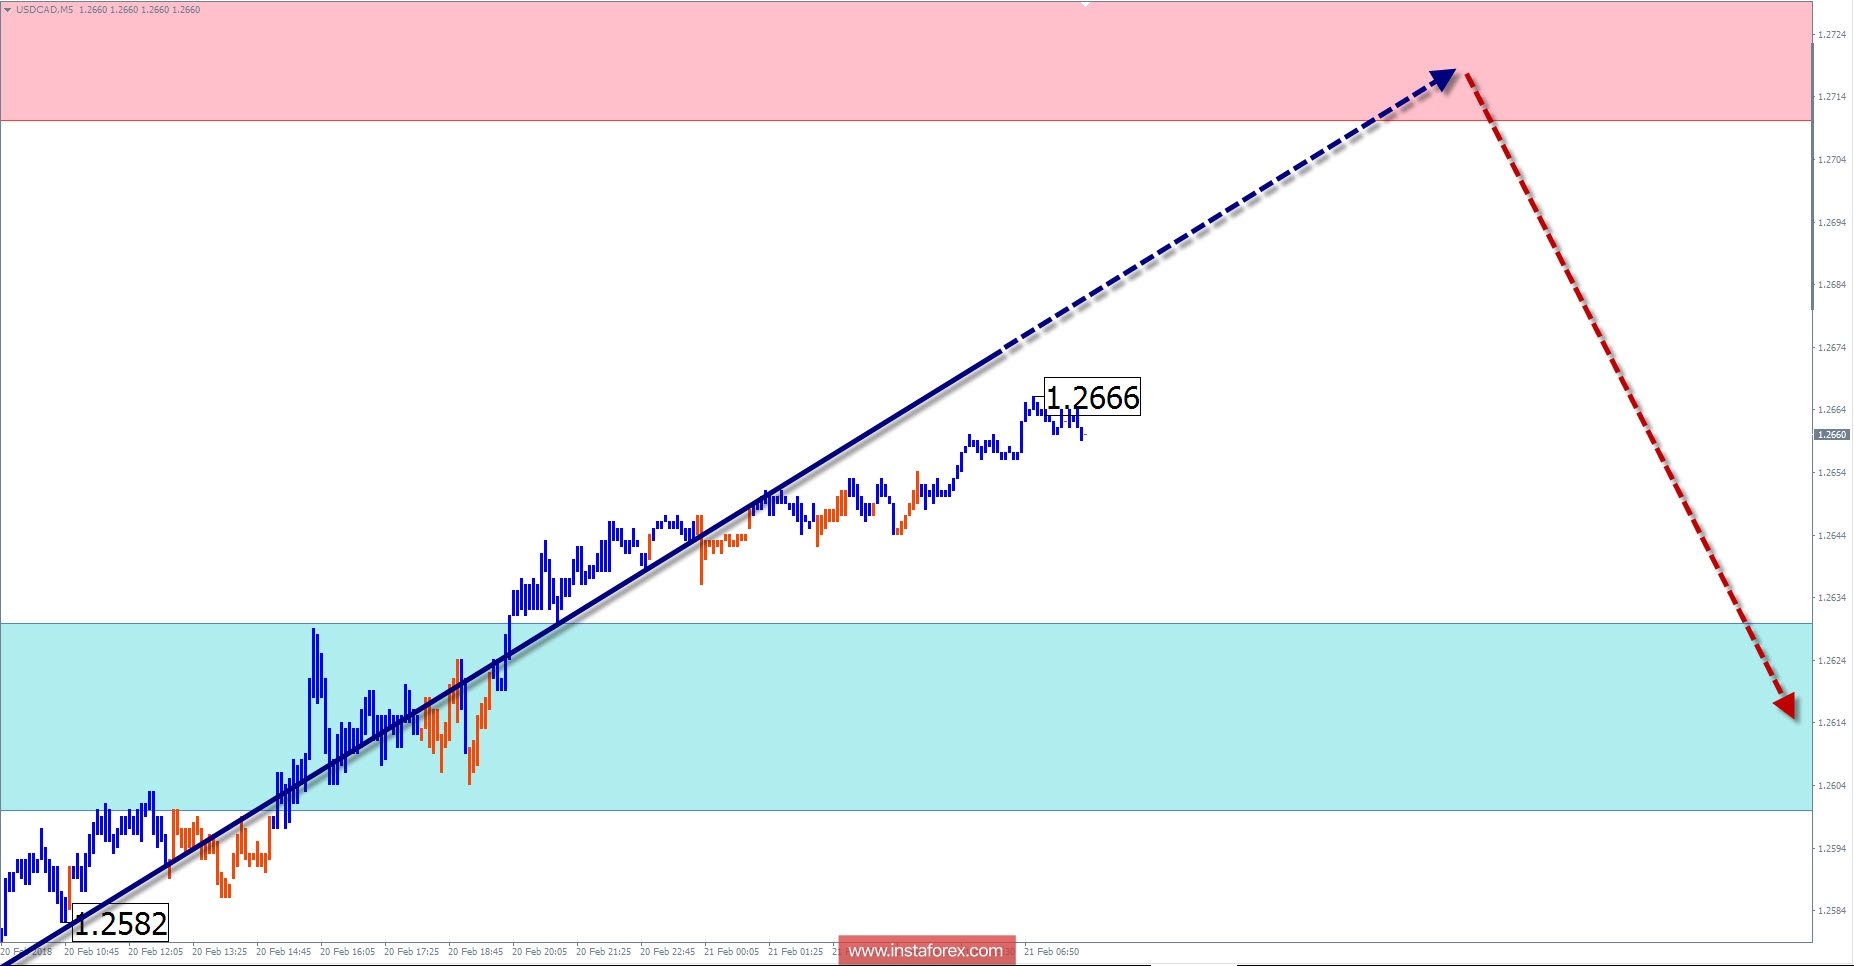
Overview and forecast for USD / CAD
At 4 o'clock scale, the chart of the major "Canadian" forms a new descending wave zigzag. The wave counts from October 27 last year, after the culminated correction ended. In the structure of the model, the middle part (B) is nearing completion. The correction wave has an irregular shape with an elongation down. Within the calculated resistance zone is the lower limit of the potential reversal section of the chart.
Over the next trading sessions, the completion of the current price increase in the last 3 weeks is expected. The short-term breakthrough of the upper boundary of the resistance zone cannot be ruled out. A change in the direction of the price movement is likely at the end of the day or tomorrow.
The boundaries of resistance zones:
- 1.2710 / 1.2740
The boundaries of support zones:
- 1.2630 / 1.2600
Explanations to the figures: For simplified wave analysis, the simplest type of wave is used in the form of a zigzag, combining 3 parts (A; B; C). Of these waves, all kinds of correction are composed and most of the impulses. At each time frame, the last, incomplete wave is analyzed.
The areas marked on the graphs are indicated by the calculation areas, where the probability of a change in the direction of motion is significantly increased. Arrows indicate the wave counting according to the technique used by the author. The solid background of the arrows indicates the structure formed, the dotted one indicates the expected wave motion.
Attention: The wave algorithm does not take into account the duration of the tool movements in time. The forecast is not a trading signal! To conduct a trade transaction, you need to confirm the signals of your trading systems.


