


Review and forecast for GBP / USD pair
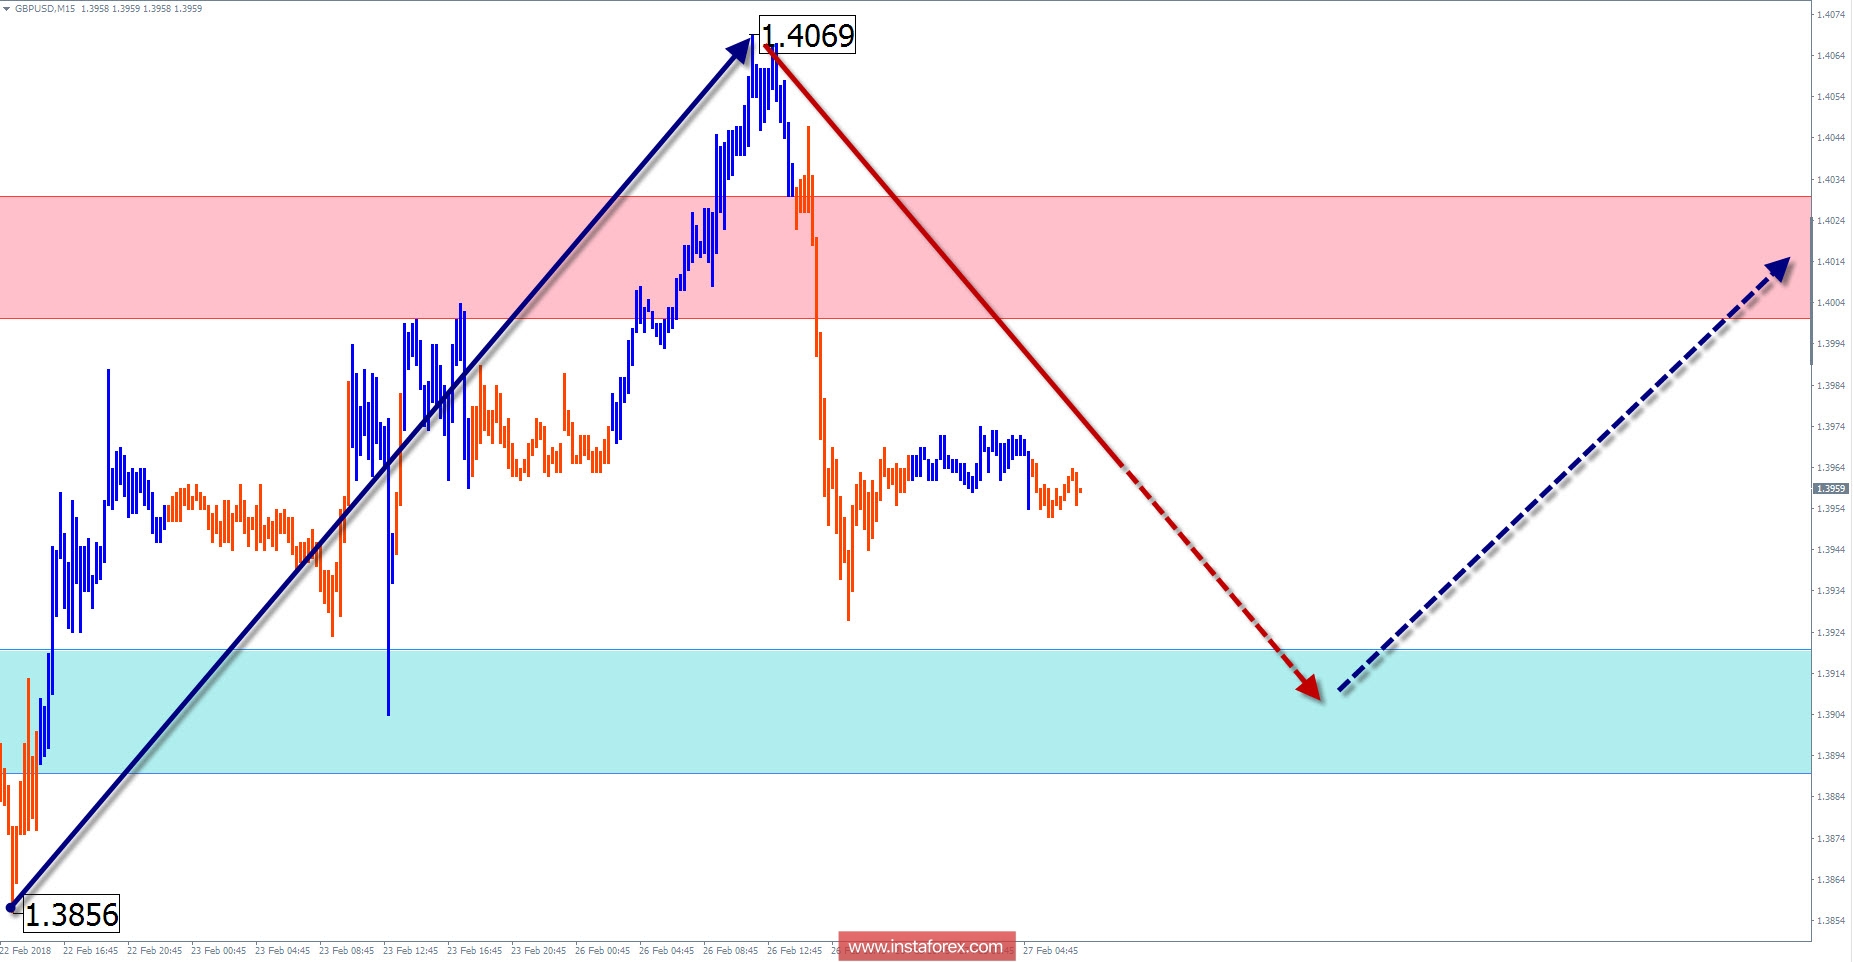
Since October 2016, quotes of the British pound major pair are moving according to the algorithm of the rising wave of the trend. The counter zone around the minimum level of wave extension last month was broken.
Before the formation of a new zigzag wave, the quotes of the pair must complete a hidden bearish correction. Its final part for the current month has a correctional figure "horizontal triangle" on the chart. The preliminary calculation of the probable zone in the course of the 137th price figure.
In the first half of the day, a downward motion vector is expected today, with the generally flat nature of the pair oscillations. At the end of the day, the chance to change the direction of change.
Boundaries of resistance zones:
- 1.4000 / 1.4030
Boundaries of support zones:
- 1.3920 / 1.3890
Review and forecast for USD / CAD pair
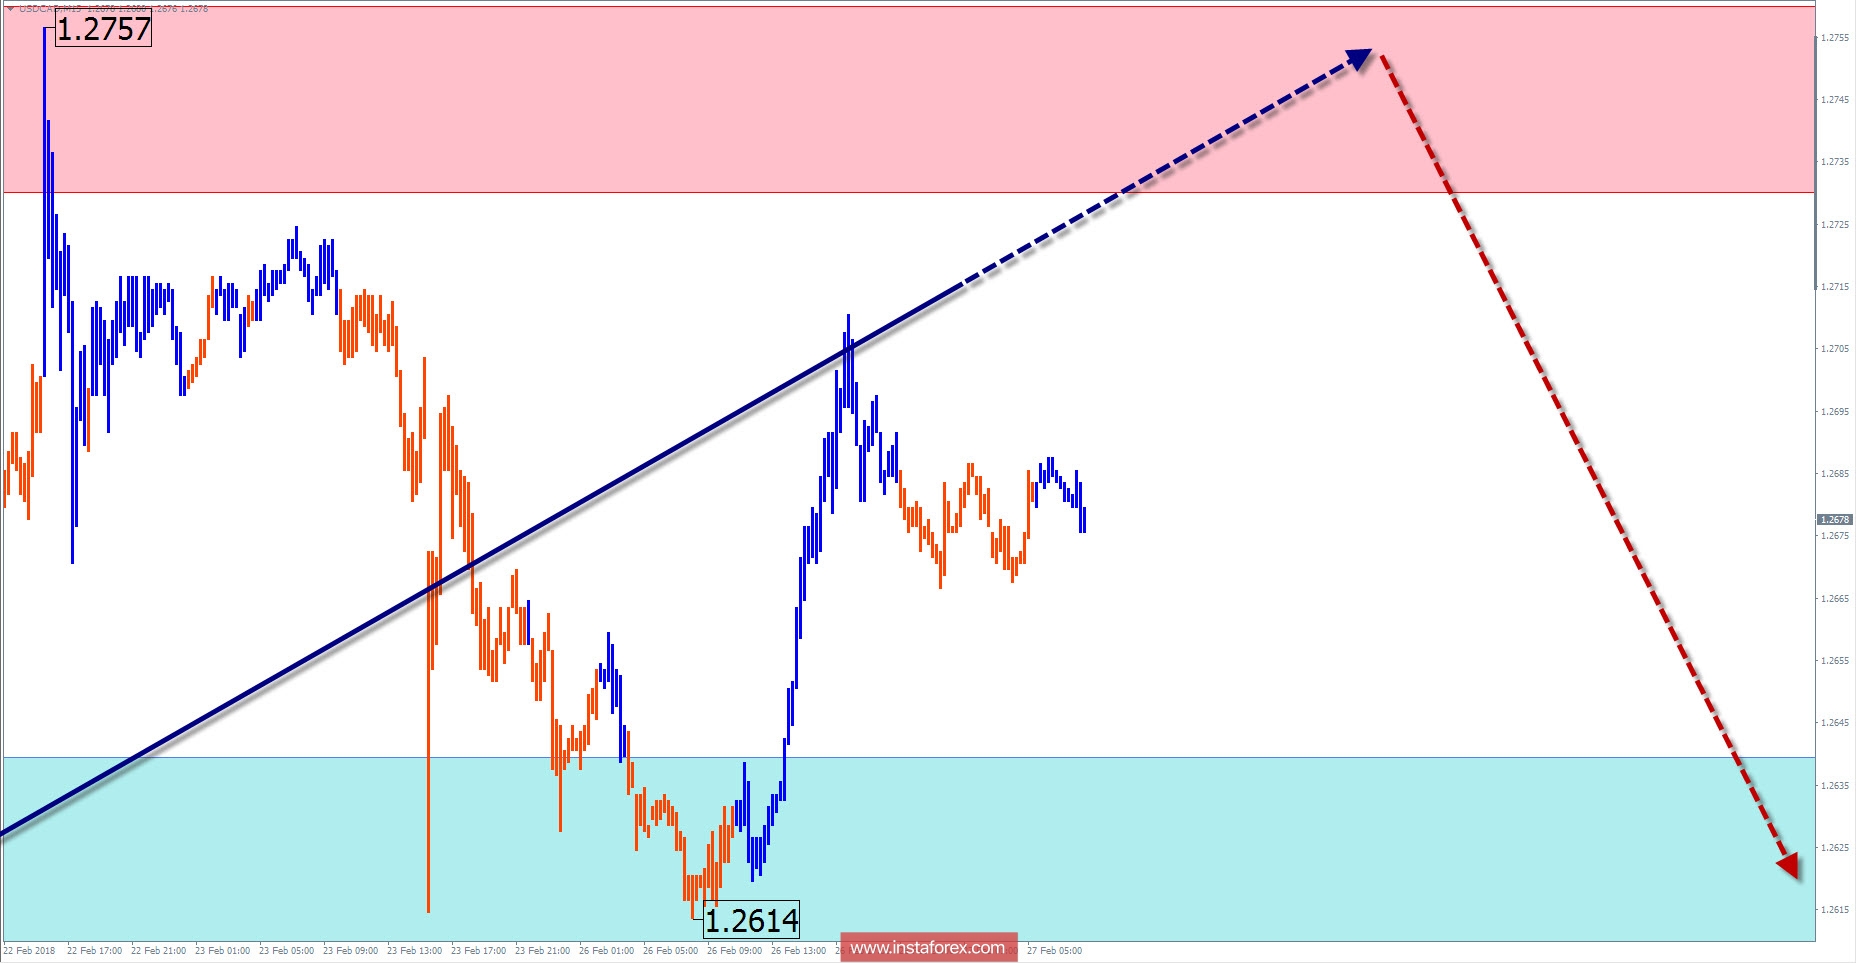
A wave picture of the Canadian dollar of the major pair against the U.S. currency shows a 4-hour scale. The last wave started since October 27 last year, which is directed downwards aiming for the development of a larger wave formation. In the structure of the zigzag, the middle part (B) is nearing completion. The price is at the bottom edge of the potential reversal zone.
Within the next 24 hours, the completion of the entire price increase for the whole month of February is expected. The settlement zone indicates the possible site of the turn. However, it is impossible to exclude short-term price breakout of the upper boundary in order to change the direction of the pair that can be expected at the end of the day or tomorrow.
Boundaries of resistance zones:
- 1.2730 / 60
Boundaries of support zones:
- 1.2640 / 10
Explanations of the figures:
For simplified wave analysis, a simple waveform is used that combines 3 parts namely A, B, and C. All types of correction are created and most of the impulses can be found in these waves. Every time frame is considered and the last incomplete wave is analyzed.
The areas marked on the graphs indicate the probability of a change in the direction of motion has significantly increased as calculated in the areas. Arrows indicate the wave counting following the technique used by the author. A solid background of the arrows signifying the structure has been formed while the dotted one means the expected wave motion.
Attention: The wave algorithm does not take into account the duration of the movement of tools in time. The forecast is not a trading signal! To conduct a bargain, you need to confirm the signals used by your trading systems.


