


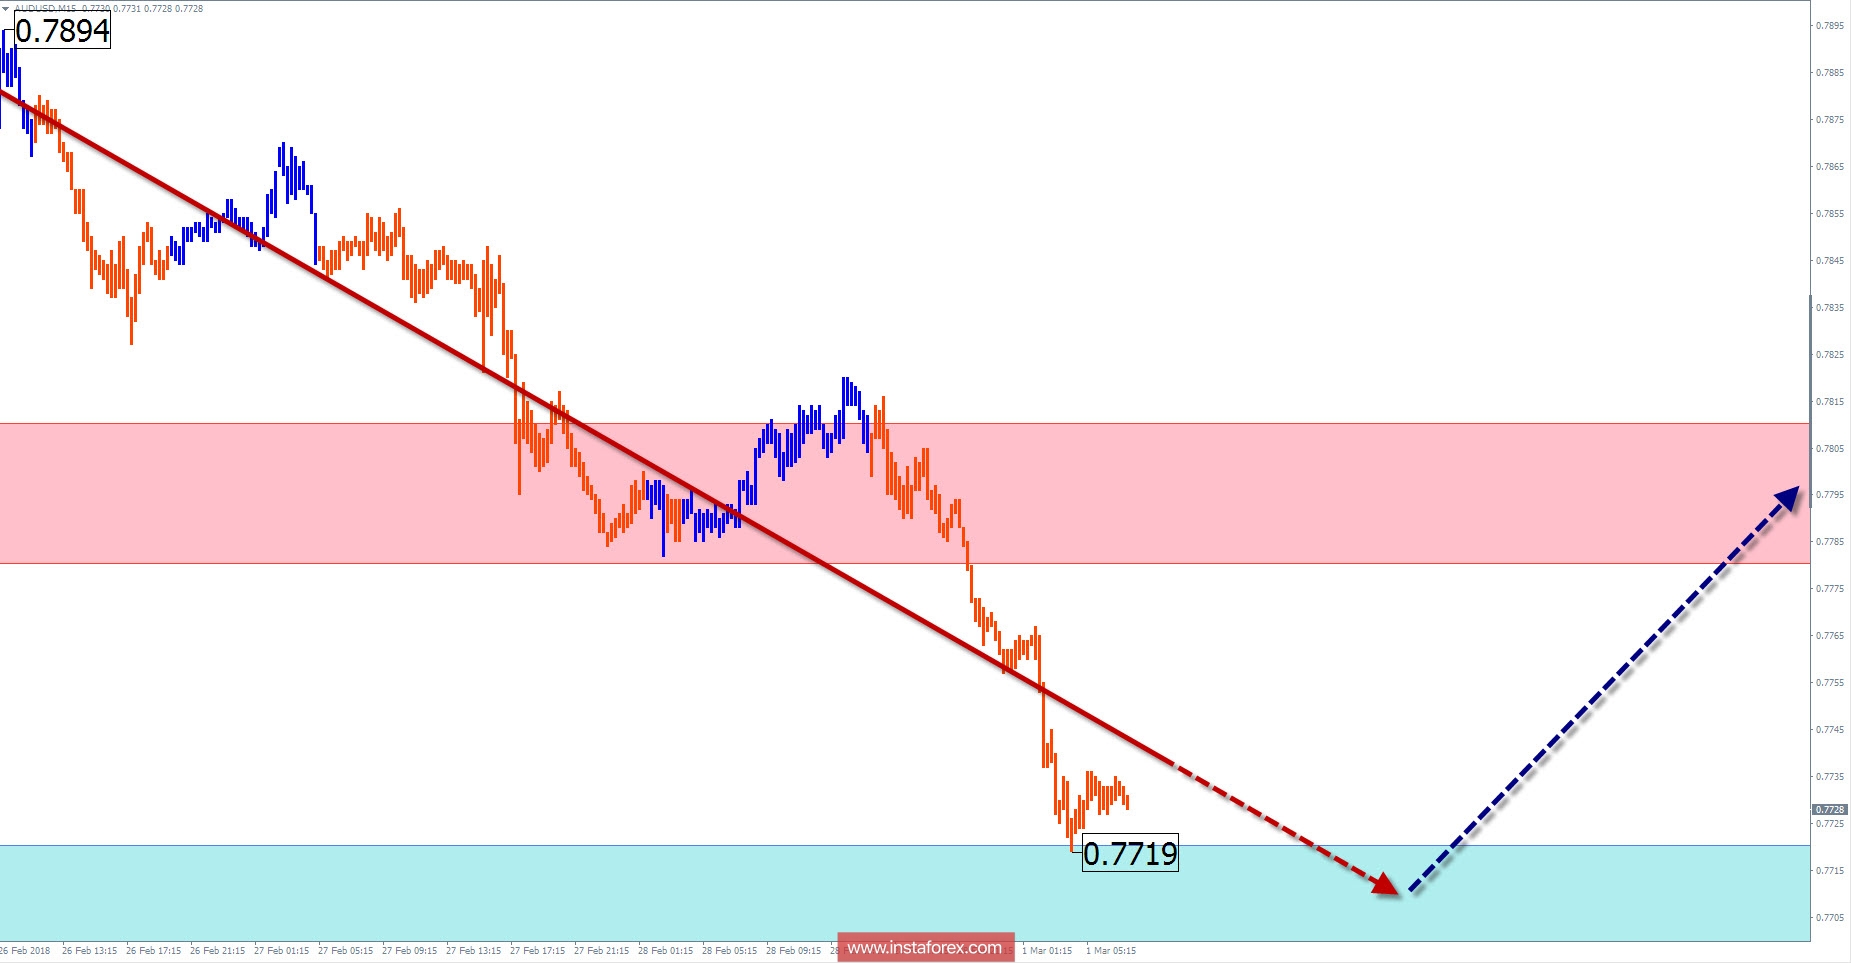
Overview and forecast for the currency pair AUD / USD
At the end of a major upward wave formation of the tool chart since September last year, a bearish correction is forming. The analysis of the structure of this wave shows the completion of the first 2 parts (A; B). The final part (C) has reached the level of the minimum possible elongation and has the form of a clear zigzag. In this area of the chart, there is a powerful level of support for a large scale, which can provoke a counter-rollback.
In the nearest trading session, the flute nature of the price movement is expected, mainly with the descending vector. In the area of settlement support, you can count on a turn. By the end of the day, the probability of the pair moving upwards increases.
The boundaries of resistance zones:
- 0.7780 / 0.7810
The boundaries of support zones:
- 0.7720 / 0.7690
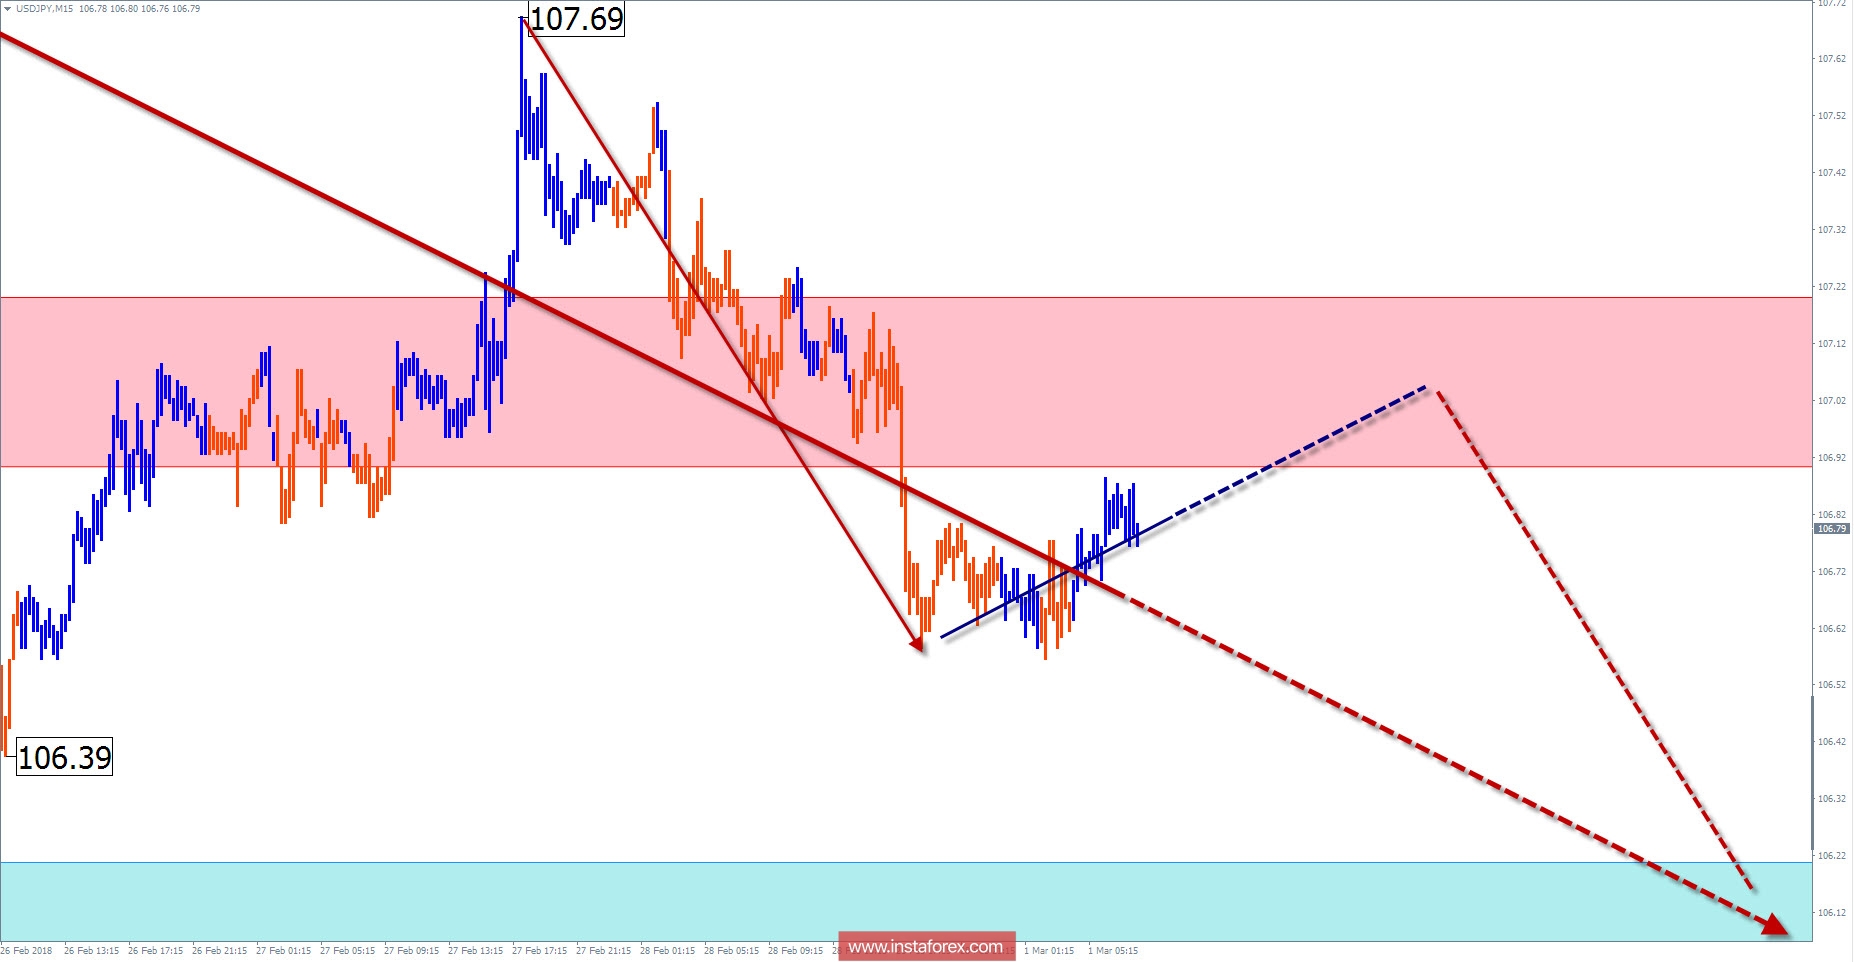
Overview and forecast for the currency pair USD / JPY
In the last 2 years, the price of the major of the Japanese yen moves according to the algorithm of the descending trend wave. On a larger scale, this plot takes the place of correction. The analysis of the wave structure shows the completeness of the entire structure. At the same time, the price reached the upper boundary of the preliminary completion zone. There are no signs of a reversal on the chart, but the time and place for their formation still remain. The width of the potential reversal zone is almost 3 price figures.
Today, the bearish sentiment of the price movement is most likely. In the morning, a short-term price hike, not beyond the resistance zone, is not ruled out. The preliminary lower bound of daily volatility is within the framework of support, but the decline may take a more impulsive character.
The boundaries of resistance zones:
- 106.90 / 107.20
The boundaries of support zones:
- 106.20 / 105.90
Explanations to the figures: For simplified wave analysis, the simplest type of wave is used in the form of a zigzag, combining 3 parts (A; B; C). Of these waves, all kinds of correction are composed and most of the impulses. At each time frame, the last, incomplete wave is analyzed.
The areas marked on the graphs are indicated by the calculation areas, where the probability of a change in the direction of motion is significantly increased. Arrows indicate the wave counting according to the technique used by the author. The solid background of the arrows indicates the structure formed, the dotted one indicates the expected wave motion.
Attention: The wave algorithm does not take into account the duration of the tool movements in time. The forecast is not a trading signal! To conduct a trade transaction, you need to confirm the signals of your trading systems.


