


As shown in the chart of the major currency Canadian dollar prevails a downward wave pattern since January 2016. In the framework of the last part (C), a counter section has appeared with a clear zigzag formation since September last year. The completion of the lower boundary of the preliminary zone is in 3 price figures above the current price level. Earlier this week, a downward correction is forming on the last part of the trend movement.
Today, it is possible to anticipate the continuation of the downward trend. In the first half of the day, a short-term price increase is possible, but not further than the upper level of the resistance zone.
Boundaries of resistance zones:
- 1.2940 / 70
Boundaries of support zones:
- 1.2840 / 10
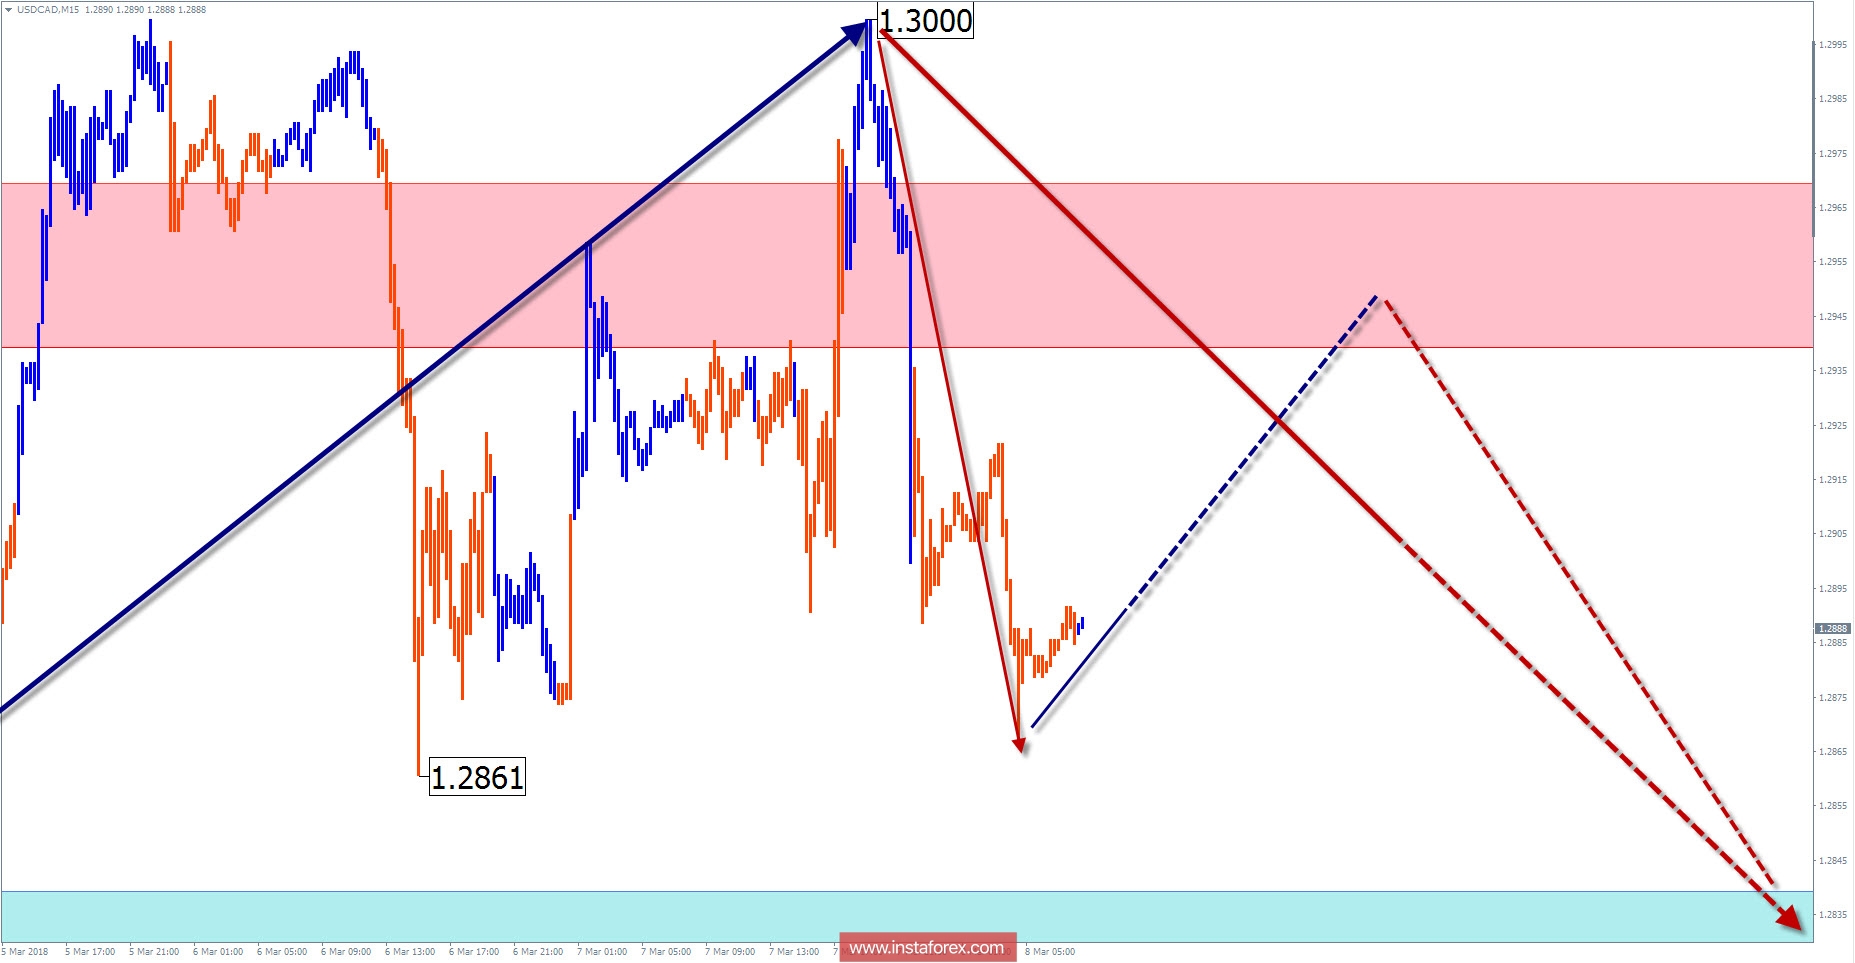
Explanations to the figures: For simplified wave analysis, the simplest type of wave is used in the form of a zigzag, combining 3 parts (A; B; C). Of these waves, all kinds of correction are composed and most of the impulses. At each time frame, the last, incomplete wave is analyzed.
The areas marked on the graphs are indicated by the calculation areas, where the probability of a change in the direction of motion is significantly increased. Arrows indicate the wave counting according to the technique used by the author. The solid background of the arrows indicates the structure formed, the dotted one indicates the expected wave motion.
Attention: The wave algorithm does not take into account the duration of the tool movements in time. The forecast is not a trading signal! To conduct a trade transaction, you need to confirm the signals of your trading systems.
* The presented market analysis is informative and does not constitute a guide to the transaction.


