


In the last 3 years, the movement of the major European currency chart forms a correctional figure "stretched plane". The final part of the wave counts from December 2016. The quotations of the pair reached a powerful counter zone of potential reversal. The analysis of the structure of the whole wave shows its incompleteness.
Within the last ascending part of the wave (C), a correction region is formed from the end of January. The nature of the movement is close to the flat. The upward movement of March 1 has a reversal potential.
Today, the completion of the downward section and the creation of conditions for a turn are expected. The change of the rate can occur already in the next trading sessions. The ascending phase of the movement is likely at the end of the day, or tomorrow.
The boundaries of resistance zones:
- 1.2330 / 60
The boundaries of support zones:
- 1.2250 / 20
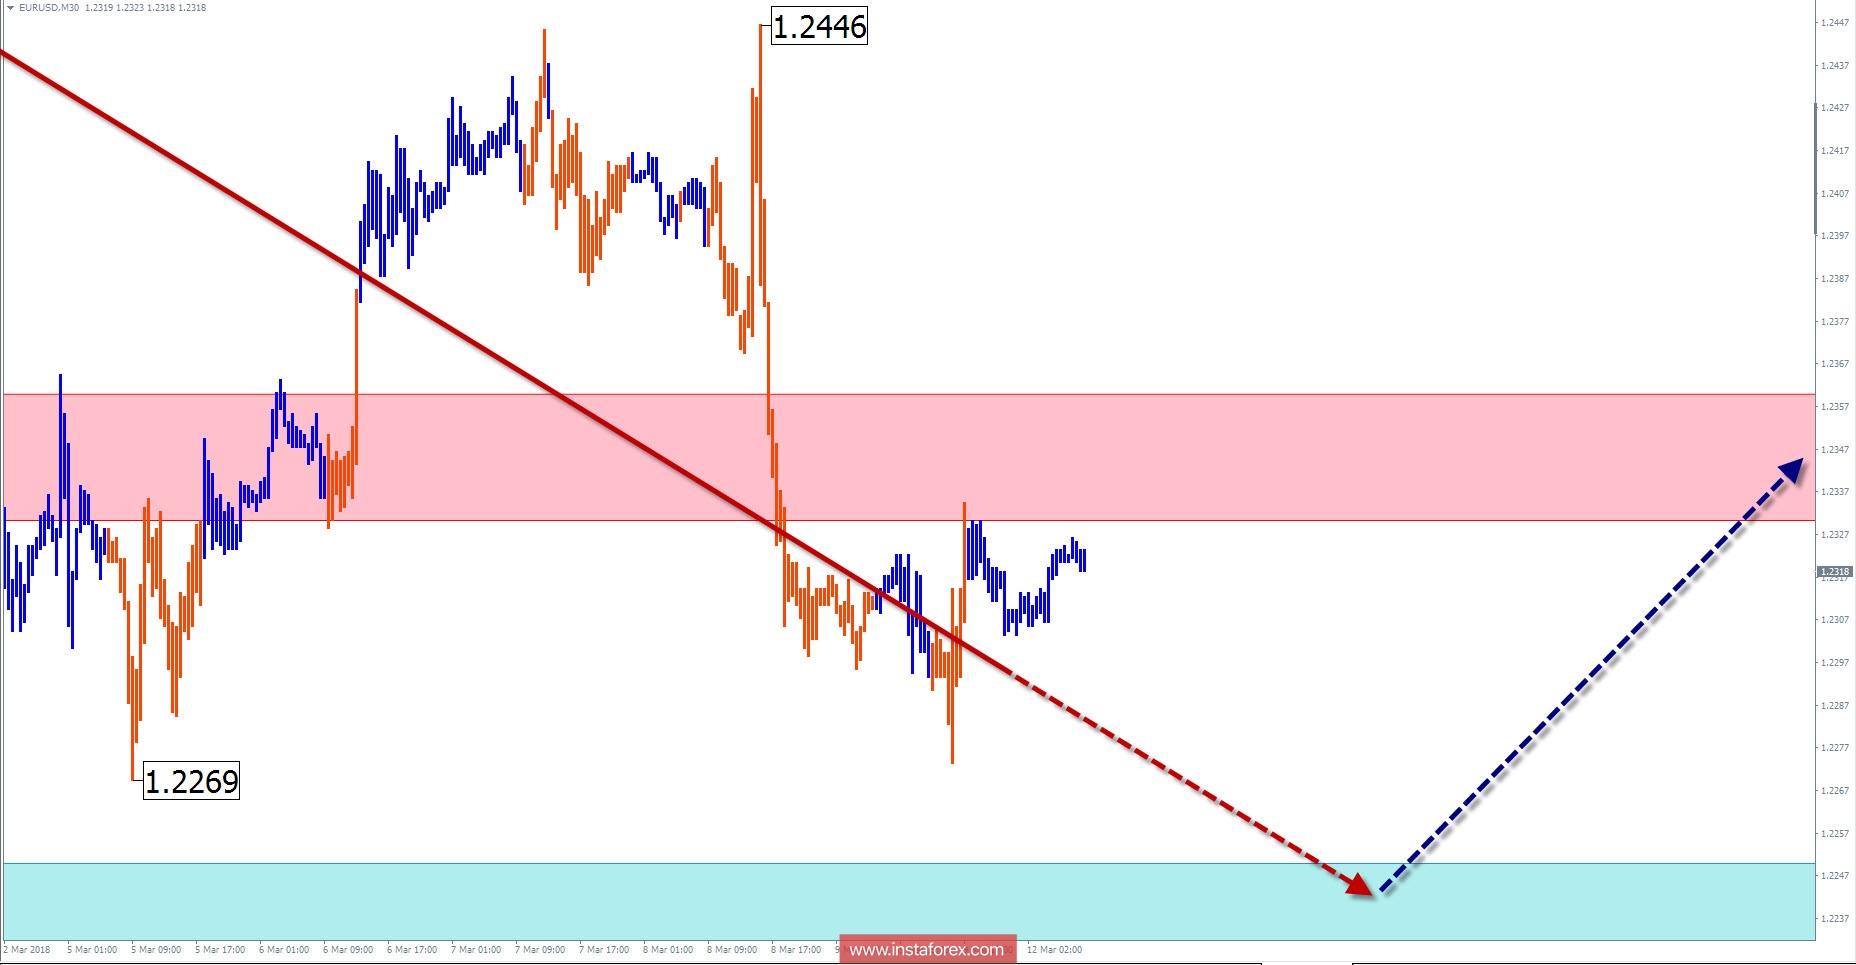
Explanations to the figures: For simplified wave analysis, the simplest type of wave is used in the form of a zigzag, combining 3 parts (A; B; C). Of these waves, all kinds of correction are composed and most of the impulses. At each time frame, the last, incomplete wave is analyzed.
The areas marked on the graphs are indicated by the calculation areas, where the probability of a change in the direction of motion is significantly increased. Arrows indicate the wave counting according to the technique used by the author. The solid background of the arrows indicates the structure formed, the dotted one indicates the expected wave motion.
Attention: The wave algorithm does not take into account the duration of the tool movements in time. The forecast is not a trading signal! To conduct a trade transaction, you need to confirm the signals of your trading systems.


