


Since December 2016, the trend direction of the major of the Japanese yen is set by a bearish wave. In a larger wave formation, it takes the place of correction. By February of this year, the price of the pair has reached the upper limit of a wide zone of potential reversal, in which the probability of completion of the entire wave increases significantly.
The rising wave, which lasts for the last 2 months, does not possess a reversal potential, so it is premature to expect a change of trend.
In the coming days of the coming week, the bullish pullback should be completed. Then you can wait for a new wave of decline. The far support zone is at the bottom edge of the potential turn area.
The boundaries of resistance zones:
- 107.00 / 107.50
The boundaries of support zones:
- 105.10 / 104.60
- 103.60 / 103.10
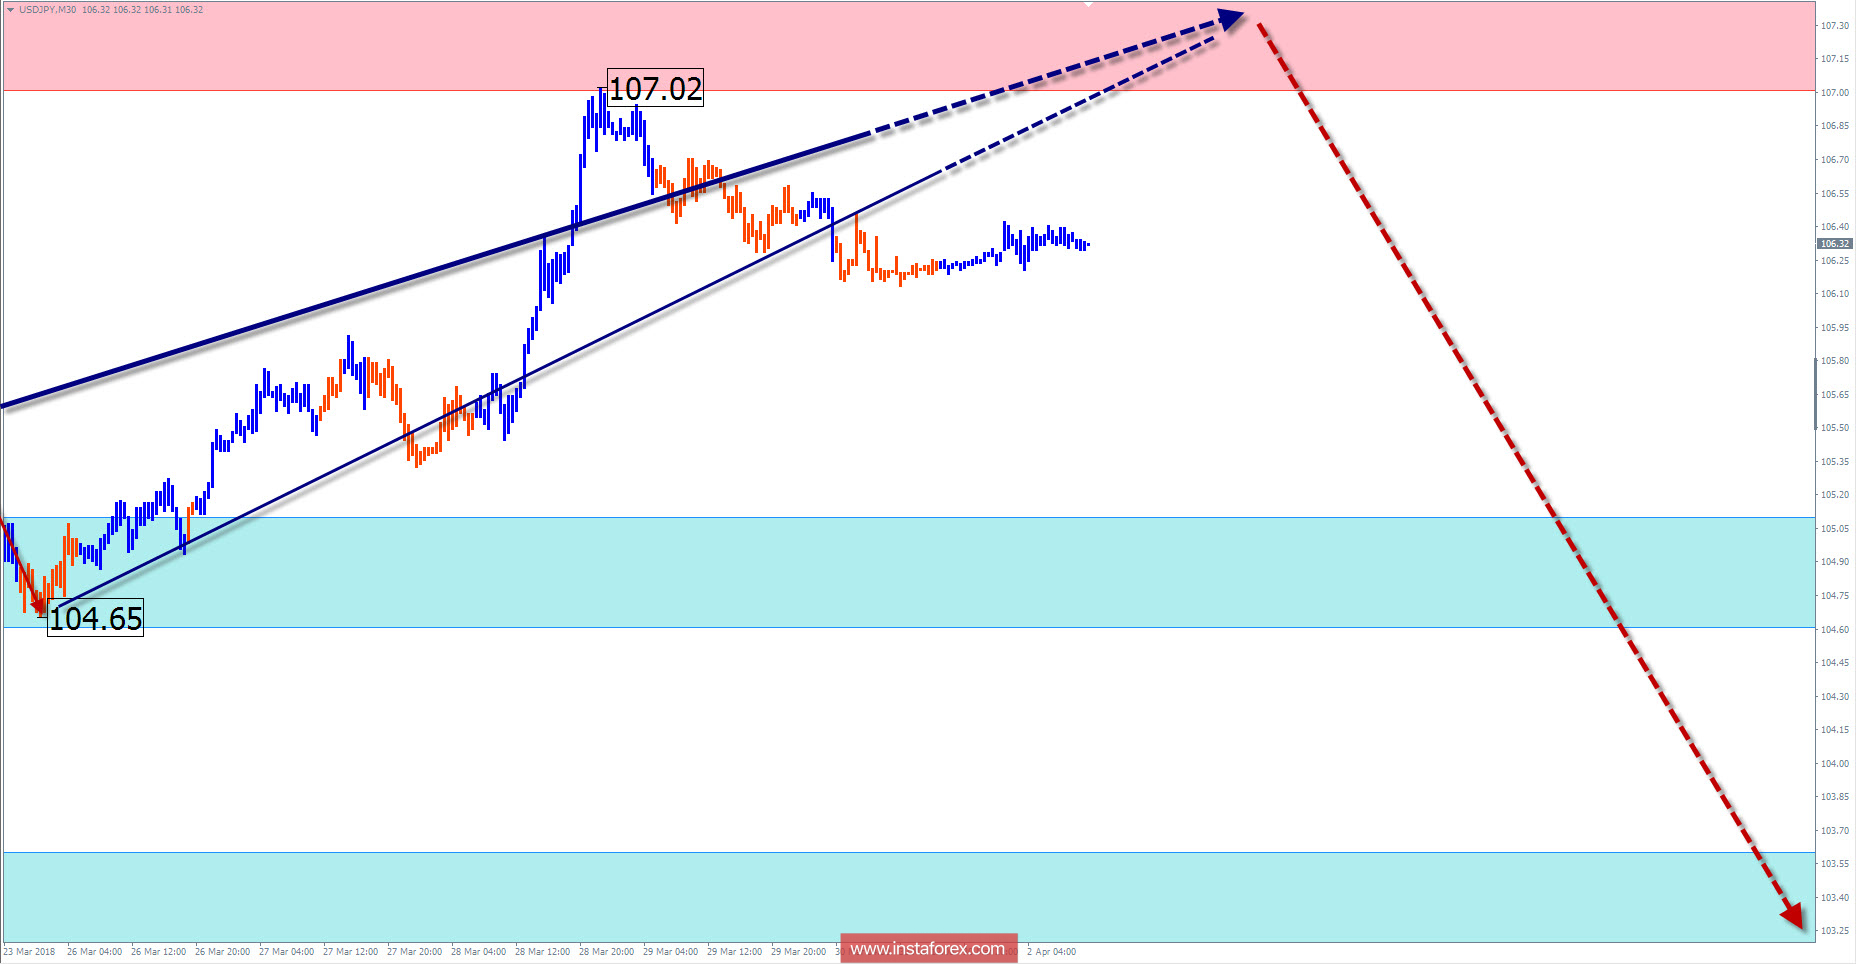
Explanations to the figures: For simplified wave analysis, the simplest type of wave is used in the form of a zigzag, combining 3 parts (A; B; C). Of these waves, all kinds of correction are composed and most of the impulses. At each time frame, the last, incomplete wave is analyzed.
The areas marked on the graphs are indicated by the calculation areas, where the probability of a change in the direction of motion is significantly increased. Arrows indicate the wave counting according to the technique used by the author. The solid background of the arrows indicates the structure formed, the dotted one indicates the expected wave motion.
Attention: The wave algorithm does not take into account the duration of the tool movements in time. The forecast is not a trading signal! To conduct a trade transaction, you need to confirm the signals of your trading systems.


