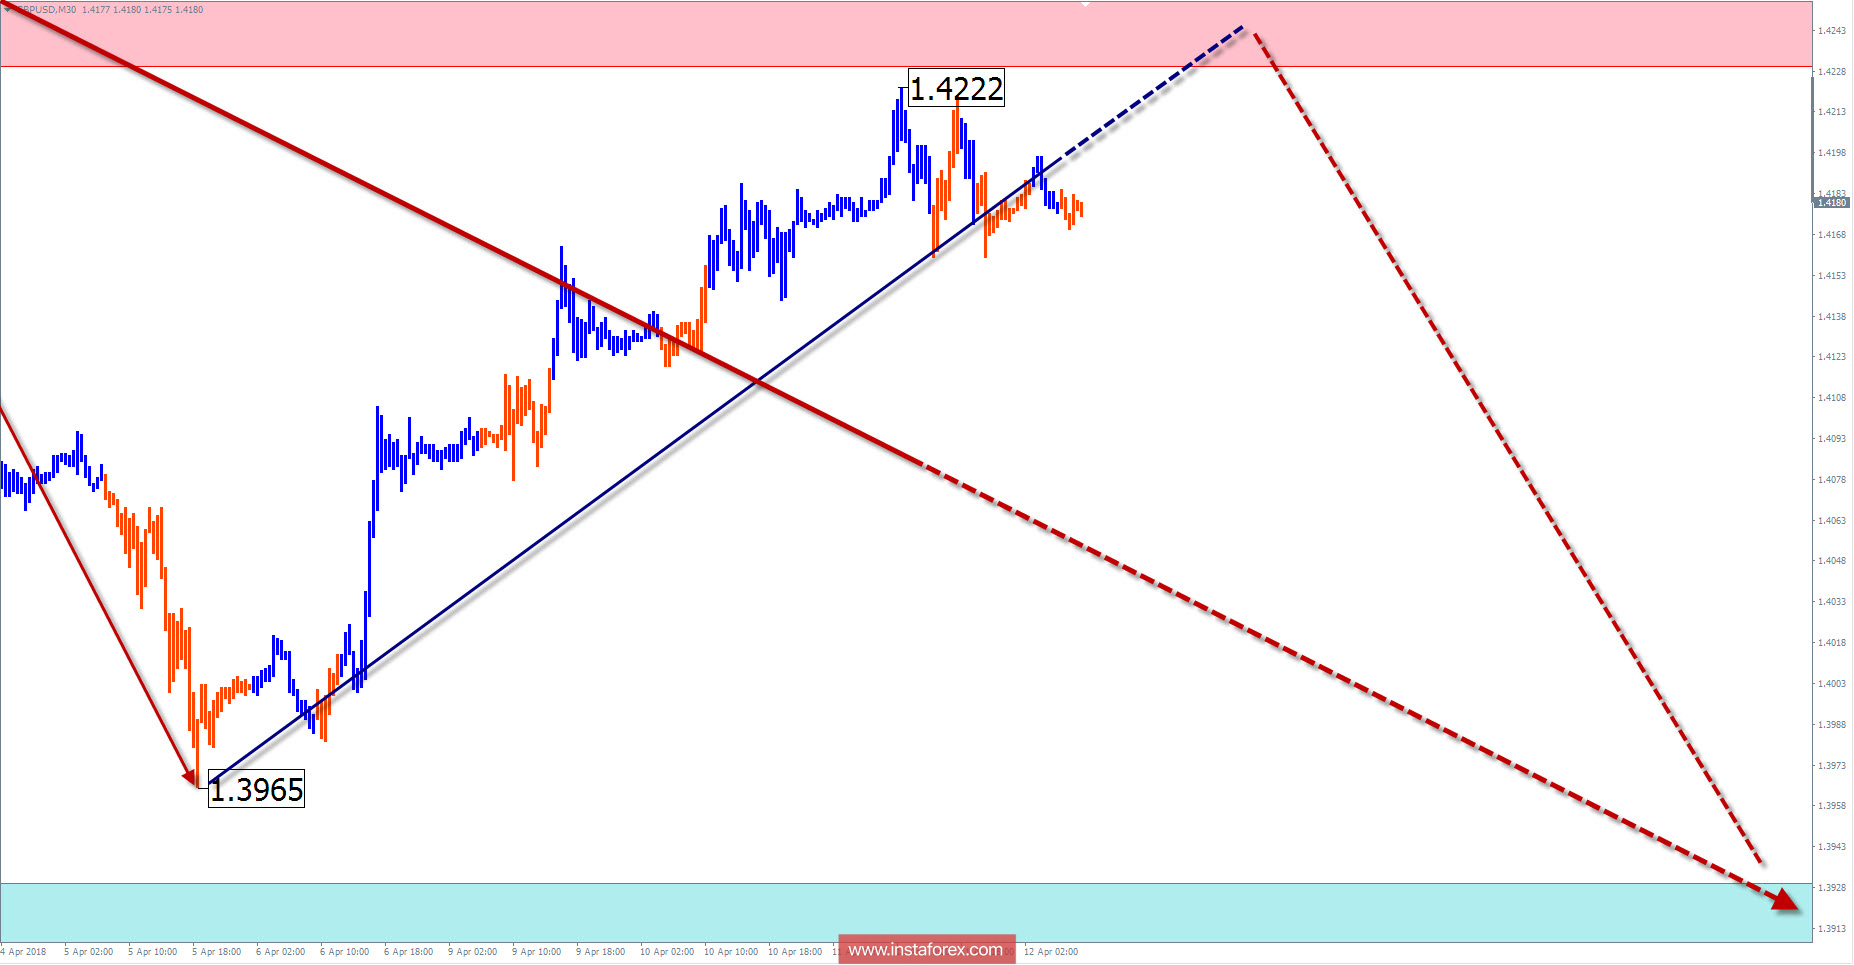
Over the past year and a half, the vector of the main price movement of the major British pound currency pair ts potential is very high, comparable to the level of the previous bearish trend. The preliminary calculation of the prospects of recovery as the nearest target zone gives a reference point in the area of the 156th price figure.
The plot reached at the end of January is near the level of resistance on a large scale. The zone formed around it provoked the formation of an intermediate correction and formed a flat range. These levels would be the boundaries of price fluctuations in the coming weeks.
In the coming trading sessions, the completion of the price increase, the reversal, and the pair's downgrade are expected. The calculated support zone will slow down the rate of decline.
Boundaries of resistance zones:
- 1.4230 / 1.4280
Boundaries of support zones:
- 1.3930 / 1.3880

Explanations of the figures:
For simplified wave analysis, a simple waveform is used that combines 3 parts namely A, B, and C. All types of correction are created and most of the impulses can be found in these waves. Every time frame is considered and the last incomplete wave is analyzed.
The areas marked on the graphs indicate the probability of a change in the direction of motion has significantly increased as calculated in the areas. Arrows indicate the wave counting following the technique used by the author. A solid background of the arrows signifying the structure has been formed while the dotted one means the expected wave motion.
Attention: The wave algorithm does not take into account the duration of the movement of tools in time. The forecast is not a trading signal! To conduct a bargain, you need to confirm the signals used by your trading systems.


