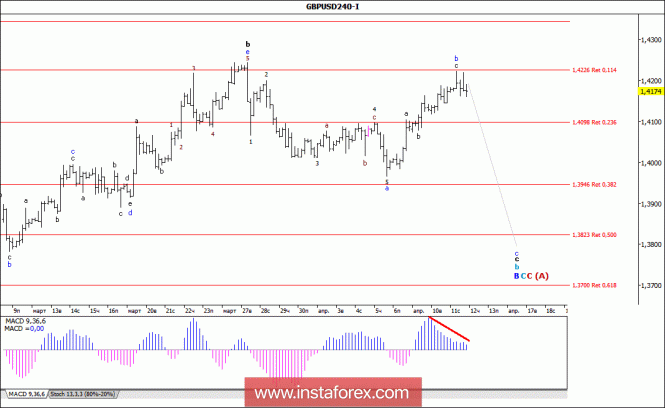
Analysis of wave counting:
Despite the unsuccessful testing of the level of the 42nd figure, the GBP / USD currency pair was still unable to determine the direction of the movement, remaining until the end of the last day near the highs reached at the beginning of the European session. At the same time, a fairly strong divergence of the MACD suggests that the currency pair has completed the process of forming the complex wave structure of wave b, c, b, B, C, C, (A). If this is the case, then from the high of the past day, the currency pair will resume the decline of quotations and thus mark the beginning of the future wave c, c, b, B, C, C, (A).
The objectives for building a downward wave:
1.3946 - 38.2% of Fibonacci
1.3823 - 50.0% of Fibonacci
The objectives for building an upward wave:
1.4200
General conclusions and trading recommendations:
The wave counting has suffered some changes. Now, we expect a resumption of the decline in quotations with targets near the calculated levels of 1.3946 and 1.3823, which corresponds to 38.2% and 50.0% of Fibonacci, within the limits of wave c, b, B, C, C, (A). The supposed wave b is close to its end, but it can get a bit more complicated with the goals, which are about 42 figures.


