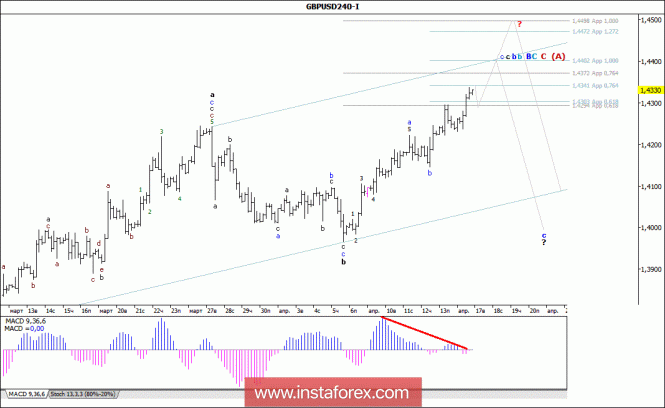
Analysis of wave counting:
At the start of the new trading week, GBP/USD pair started with an upward movement and, adding about 100 percentage points in price in the second half of the last day was able to work out the mark of 1.4335. The resulting wave situation allows us to assume that the internal wave structure of the correctional wave b, in B, in C, in C, in (A) began to acquire the features of a diagonal triangle. If this is the case, then a strong overbought of the indicators and a significant divergence of the MACD_aka indicate that the currency pair is trying to complete the process of forming the wave c, in b, in b, in B, in C, in C, in (A).
Targets for a downward wave option:
1.4100 - 1.4200
Targets for an upward wave option:
1.4372 - 76.4% by Fibonacci
1.4498 - 100.0% by Fibonacci
General conclusions and trading recommendations:
Wave counting continues to become complicated and tangled. In the framework of the construction of the wave c, in b, in b, in B, in C, in C, in (A), the increase in quotations may continue with targets located near the estimated marks of 1.4372 and 1.4498, which equates to 76.4 % and 100.0% of Fibonacci. The MACD_aka divergence warns of the trading instrument's willingness to build a bearish wave.


