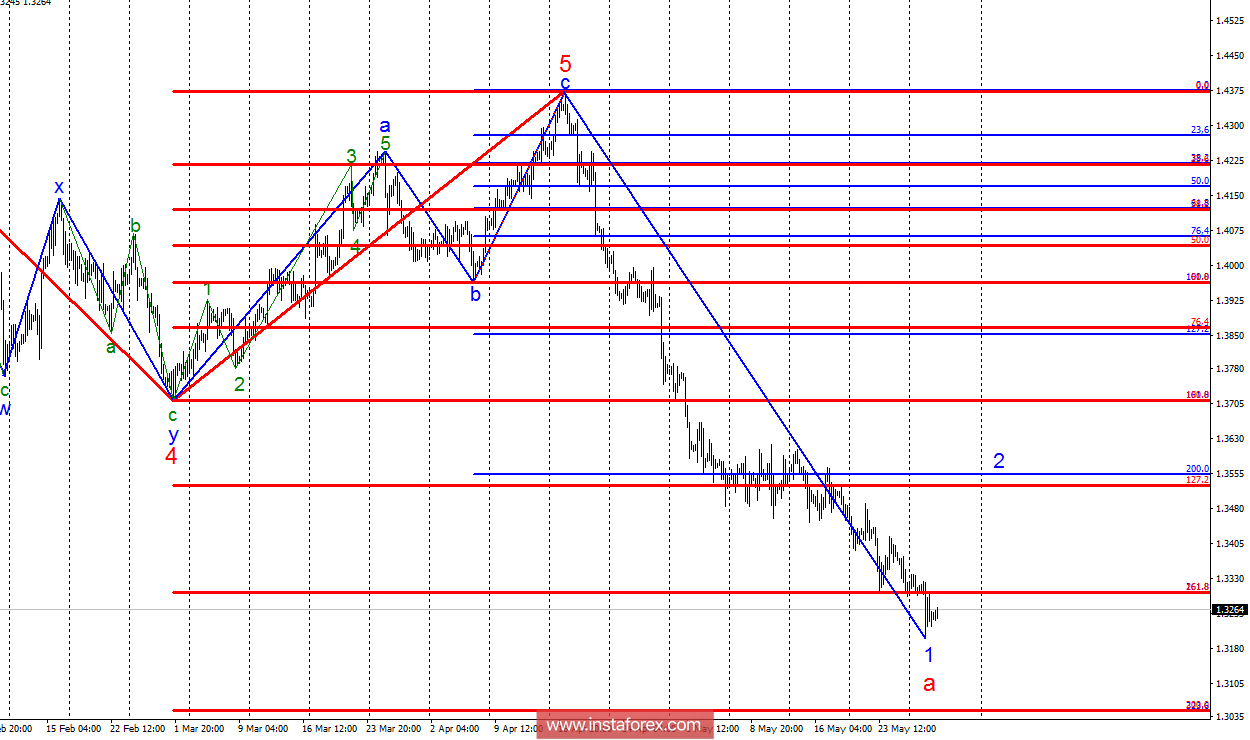
Analysis of wave counting:
During trading on May 29 the GBP/USD currency pair returned to the decline and, having lost more than 100 points, went under the level of 33 figures. Proceeding from this, it suggests the conclusion about the next complication of wave 1, in a, of the bearish part of the trend. The objectives of this wave are now located up to the mark of 1.3050. The structure of wave 1, in a, perfectly reflects the strength of the downward trend - it is very difficult to determine the internal waves in it. Thus, we expect the pair to fall further.
Targets for buying:
1.3528 - 127.2% of the Fibonacci of the highest order
1.3555 - 200.0% by Fibonacci
Targets for selling:
1.3045 - 200.0% on the Fibonacci of the highest order
General conclusions and trading recommendations:
The next attempt to complete the construction of wave 1, in a failed. Breakthrough 33 figures led to an even more complicated this wave. Therefore, it is recommended selling the pair with the targets located near the calculated mark of 1.3045, which corresponds to 200.0% of Fibonacci, constructed from the size of wave 5 of the upward trend segment. Purchases of the pair, after the breakthrough of the mark of the 33 figure, it is recommended to consider only after receiving the signal about the end of wave 1, a.


