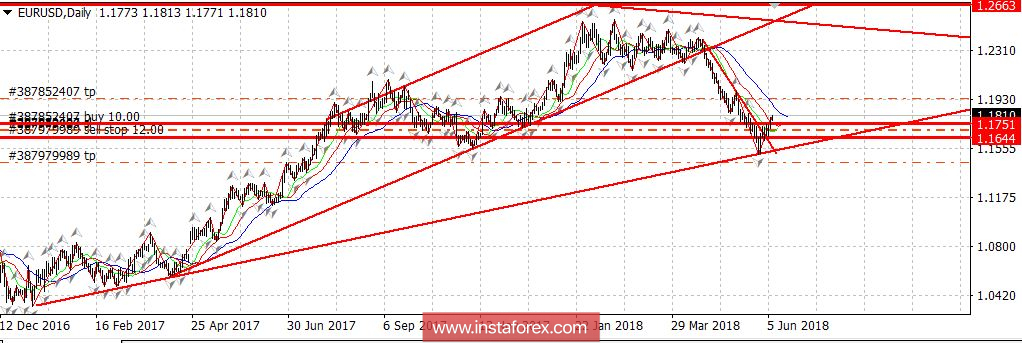
EUR / USD: Let's analyze.
Take the daily chart of the euro, turn on a large scale.
What do we see?
First, there was a global growth trend from December 2016 to April 19, 2018, from about 1.0500 to about 1.2500.
(Perhaps this trend will continue and fall to 1.1500. No more than a correction).
Secondly, there was a downtrend for the euro from April 19 to May 29 from 1.2400 to 1.1500.
Note that a strong rebound to the top occurred exactly from the support line of the global trend upward (from 1.1509).
It is likely that the trend is already down and we see a reversal.
All are interested, of course, but what's next?
First, very likely, almost 100% we will see a strong decline towards 1.1500 in the next few trading days (maximum until the end of next week, I believe). Thus, we will see while the maximum of the local range is drawn.
Secondly, there are options: Break down at 1.1509, fix below, and continue the trend down.
One option is to draw a "second bottom" in the area of 1.1500 - 1.1600 and consolidation. Next is the exit or up or down.
We are taking positions in a new direction.


