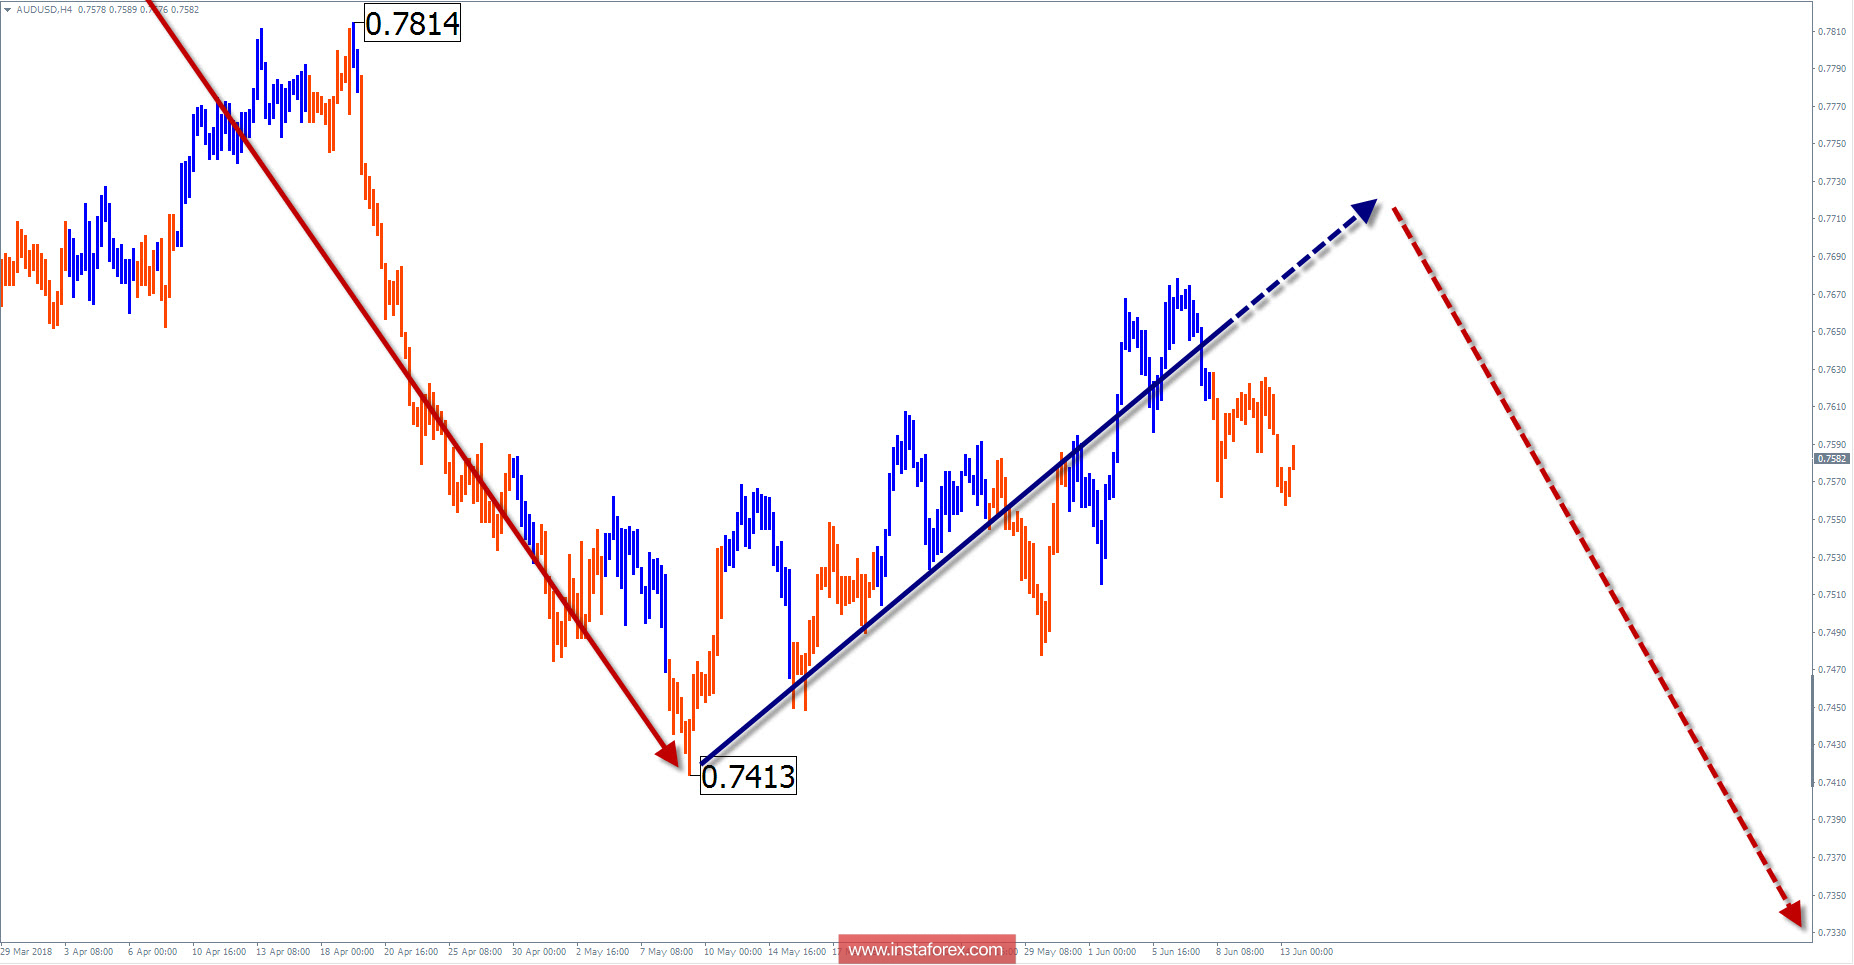
The wave pattern of the H1 graph:
The bearish wave of the major "Aussie" since January 26 in a higher timeframe takes the place of the final part (C). A contemptible calculation allows you to wait for about 3 figures to the target zone.

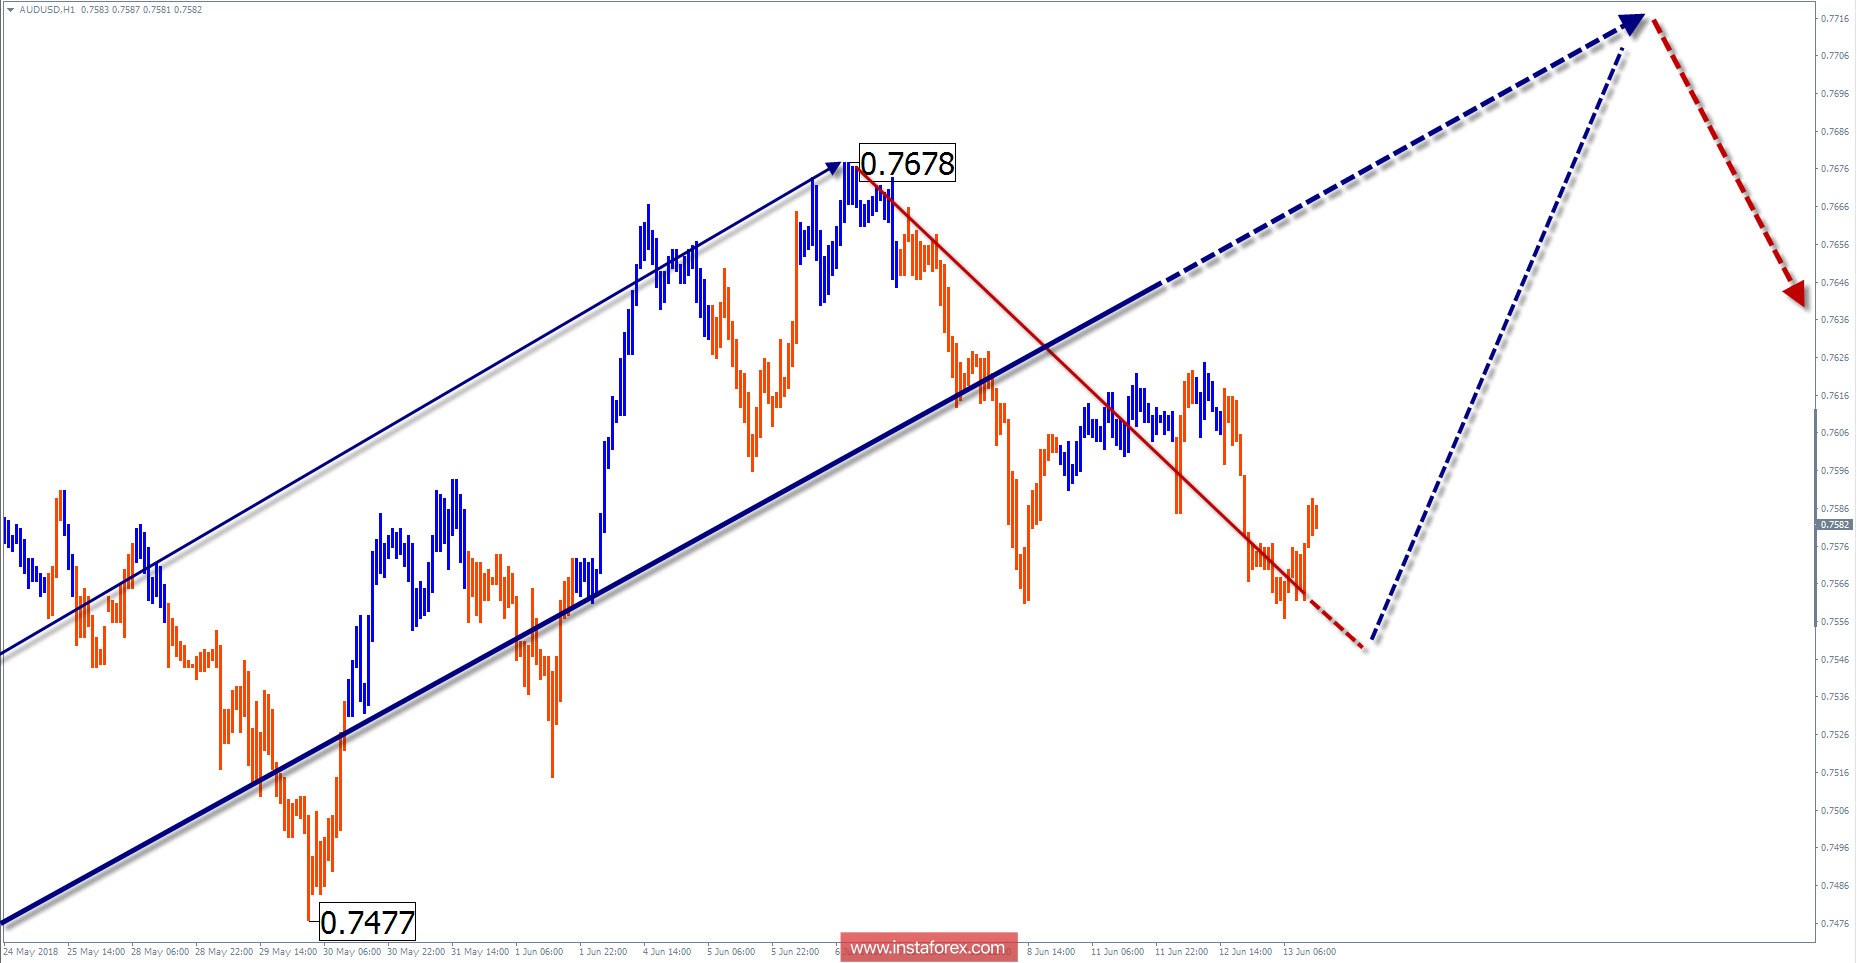
The wave pattern of the H1 graph:
Since May 9, quotations of the pair form a bullish wave. For the main trend, it forms a correction.

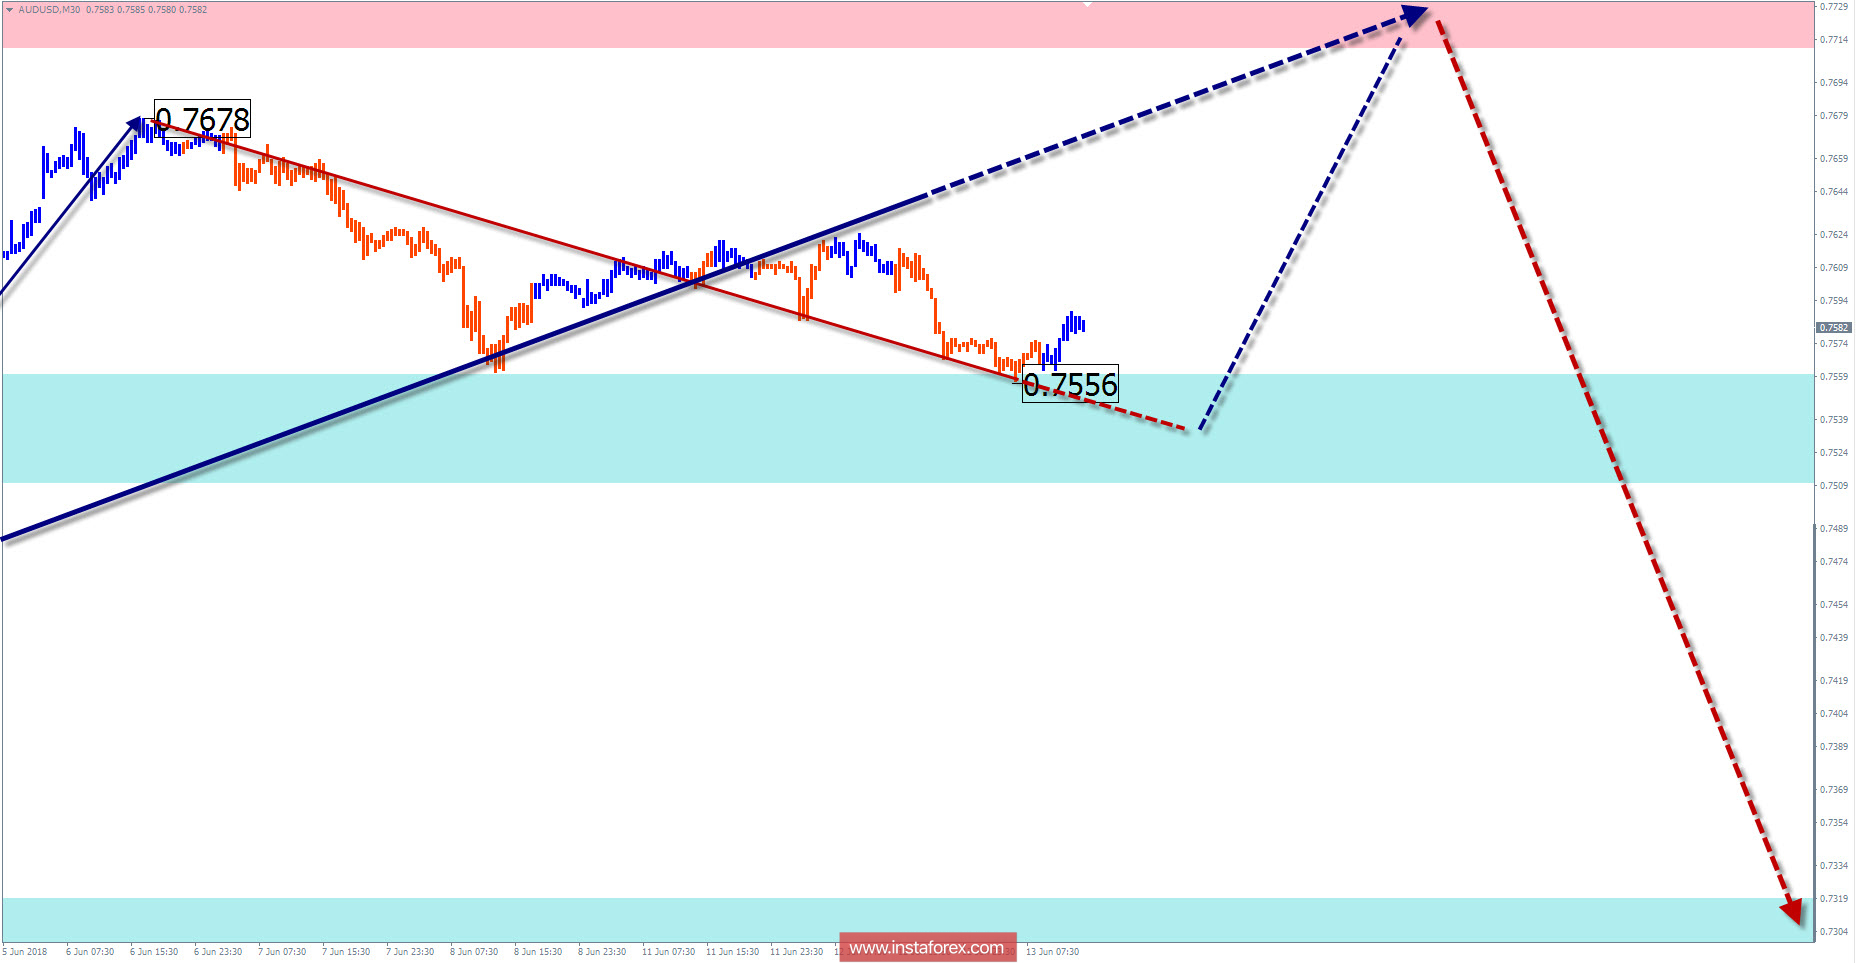
The wave pattern of the M15 chart:
The bearer section of June 6 corrects the first part of the zigzag wave (part AB).

Recommended trading strategy:
Next week, conditions for short-term purchases will appear only for inside day transactions. n the resistance zone, traders of larger timeframes are recommended to track sales signals.
Resistance zones:
- 0.7710 / 0.7760
Support zones:
- 0.7560 / 0.7510
- 0.7320 / 0.7270
Explanations to the figures:
A simplified wave analysis uses a simple waveform, in the form of a 3-part zigzag (ABC). The last incomplete wave for every timeframe is analyzed. Zones show the calculated areas with the greatest probability of a turn.
Arrows indicate the counting of wave according to the technique used by the author. The solid background shows the generated structure and the dotted exhibits the expected wave motion.
Attention: The wave algorithm does not take into account the duration of the tool movements in time. To conduct a trade transaction, you need to confirm the signals used by your trading systems.


