EUR / USD pair
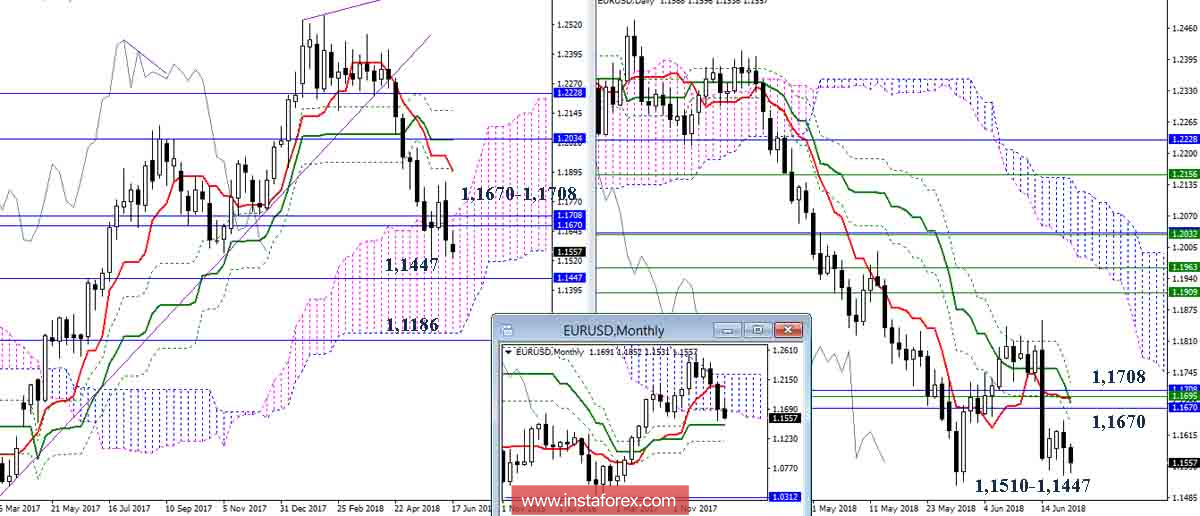
Recently, the players on the fall were able to actively and effectively return to the weekly cloud, while they exited the monthly cloud, leaving the bear zone. Now the main question is whether the players will have enough power to restore the downward movement (minimum extremum 1.1510) and to overcome the support of the monthly Kijun (1.1447). In case the bears' succeeds, the further target will be a decrease to the lower boundary of the weekly cloud (1.1215) and testing for the strength of the final line of the monthly gold cross (1.1186). The inability to reliably overcome the support zone 1.1510-1.1447, as well as the return and consolidation above the key resistance zone of 1.1670-1.1708, will allow to speak about a victory within the limits of the current correction of players on the rise. This combines the most important levels of all the older time intervals (day cross + the boundaries of the weekly and monthly clouds). Such a circumstance will undoubtedly lead to the appearance of new prospects and opportunities for the further restoration of bullish positions.

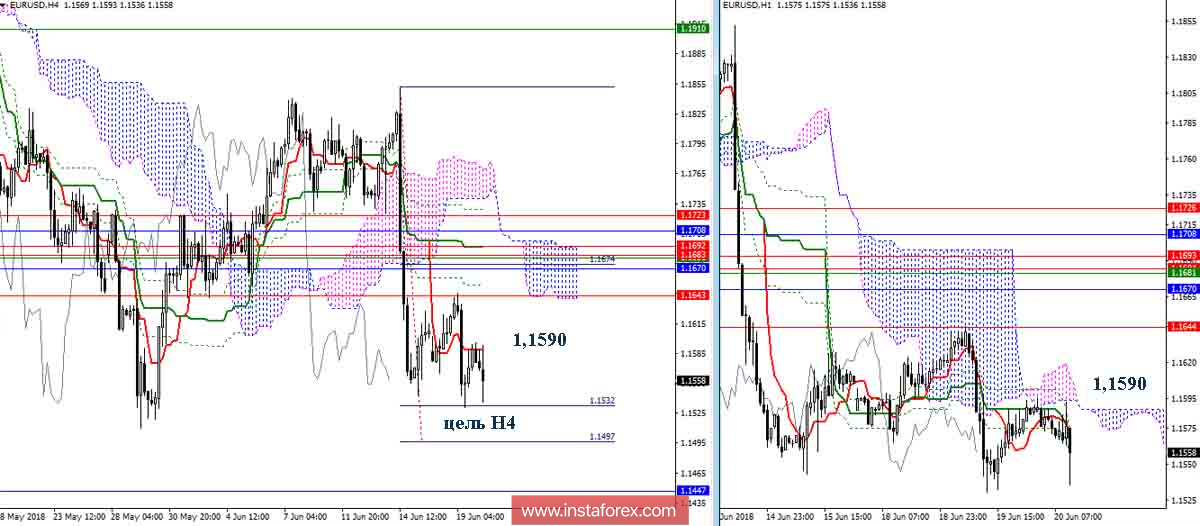
Lower timeframes are now in solidarity with the above conclusions. You can add 100% target to the bearish landmarks the development to the breakdown of the H4 cloud (1.1497), and full support of bullish sentences by the Ichimoku indicator ). The initial stage in restoring the Ichimoku support is now located above 1.1590 (Tenkan H4 + cloud H1).
Indicator parameters:
all time intervals 9 - 26 - 52
Color of indicator lines:
Tenkan (short-term trend) - red,
Kijun (medium-term trend) - green,
Fibo Kijun is a green dotted line,
Chikou is gray,
clouds: Senkou Span B (SSB, long-term trend) - blue,
Senkou Span A (SSA) - pink.
Color of additional lines:
support and resistance MN - blue, W1 - green, D1 - red, H4 - pink, H1 - gray,
horizontal levels (not Ichimoku) - brown,
trend lines - purple.


