4h

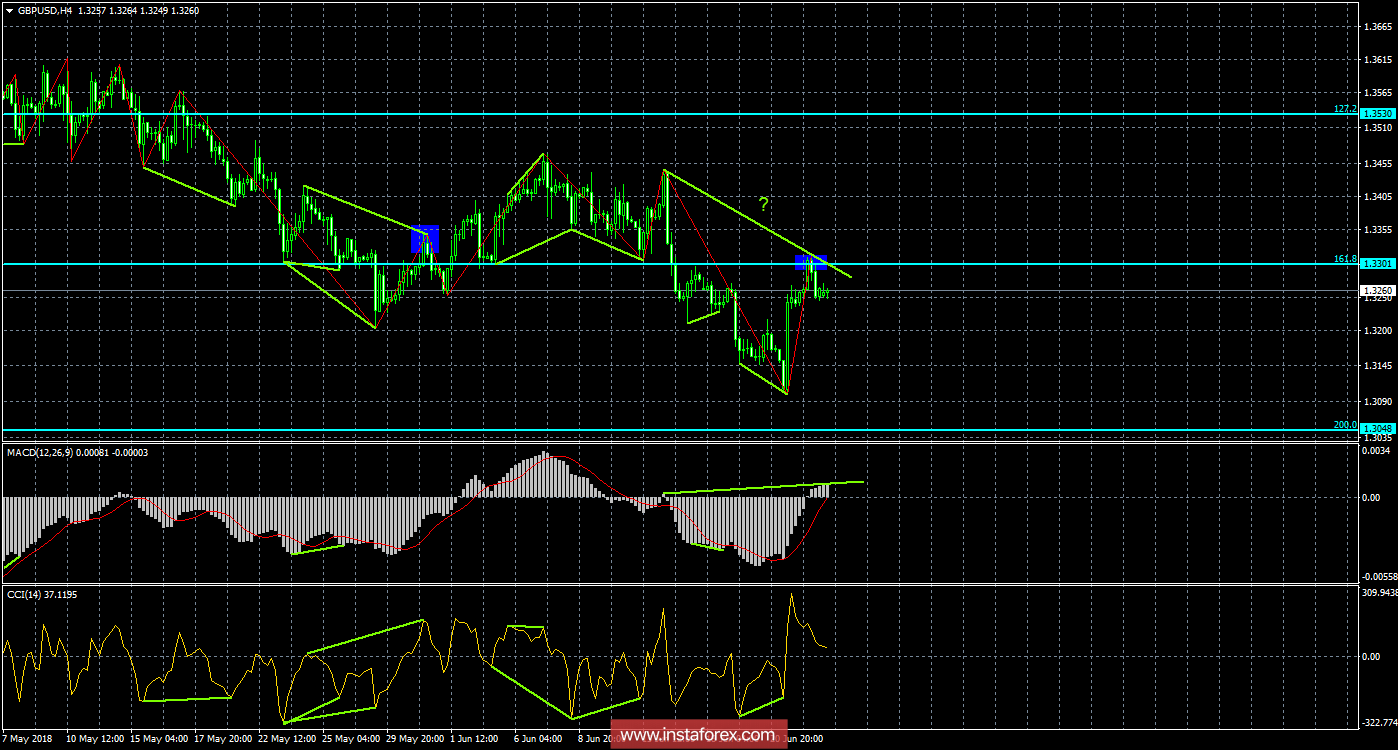
The GBP/USD pair on the 4-hour chart has increased to the level of Fibonacci 161.8% - 1.3301. The pullback of quotes from this level of correction allowed an execution of a reversal in favor of the US currency and started a fall towards the Fibonacci level of 200.0% - 1.3048. Furthermore, a bearish divergence of the MACD indicator is brewing, which may increase the chances of a continued decline in quotations. Fixing the pair above the correction level of 161.8% will work in favor of continuing growth towards the next correction level of 127.2% - 1.3530.
The Fibonacci grid is built on extremes from March 1, 2018 and April 17, 2018.
1h

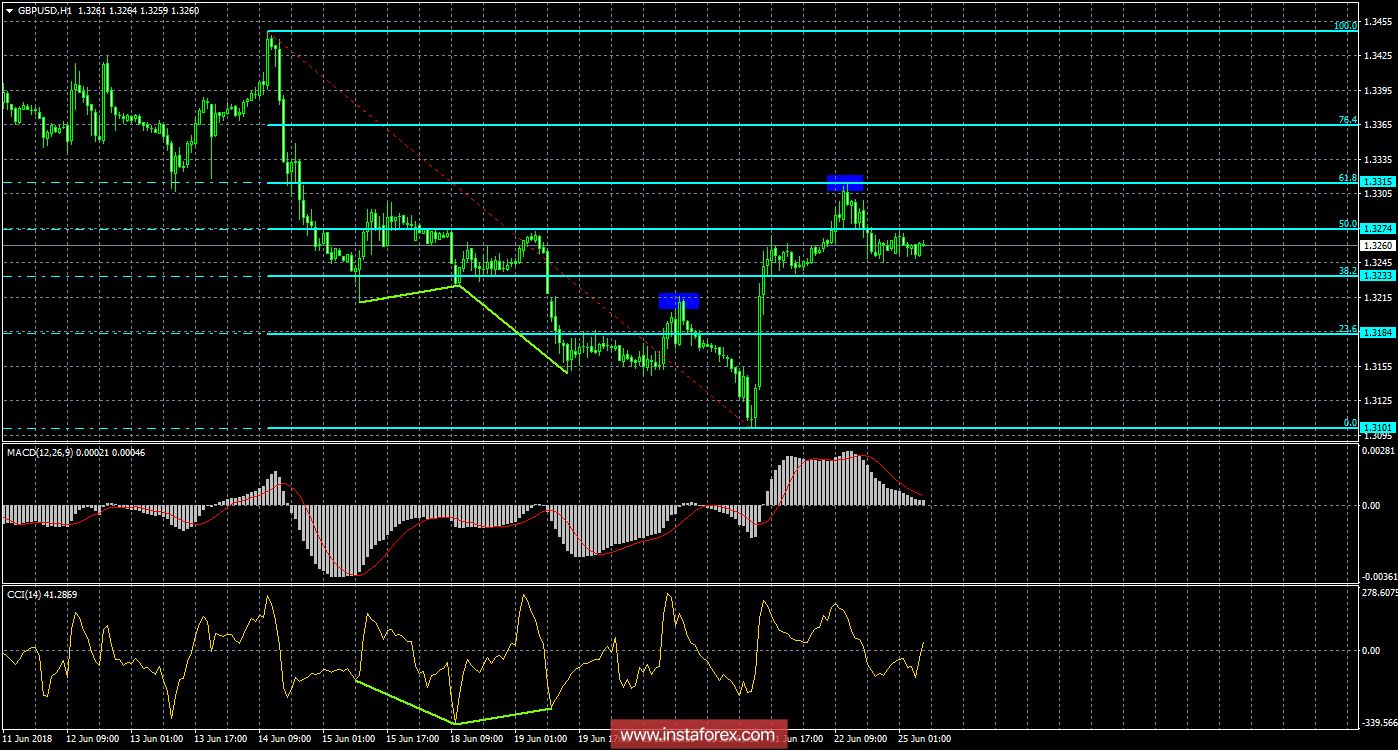
On the hourly chart, the GBP/USD pair performed a rebound from the correction level of 61.8% - 1.3315 and a reversal in favor of the US dollar. The quotes were subsequently closed at the Fibonacci level of 50.0% - 1.3274. Thus, the process of falling can be continued in the direction of the next correction level of 38.2% - 1.3233. There are no emerging divergences on June 25. Fixing the pair under the Fibonacci level of 38.2% will increase the probability of continuing the fall in the direction of the next correction level of 23.6% - 1.3184.
The Fibonacci grid is built on the extremes of June 14, 2018 and June 21, 2018.
Recommendations for traders:
New purchases of the GBP/USD pair can be opened with the target of 1.3315 and a Stop Loss order under the correction level of 1.3274, if the pair closes above the Fibonacci level of 50.0% (hourly).
To sell the GBP/USD pair, it can now be traded with targets of 1,3233 and 1,3184 and a Stop Loss order above the correction level of 50,0% (hourly chart), as there was close under the level 1,3274.


