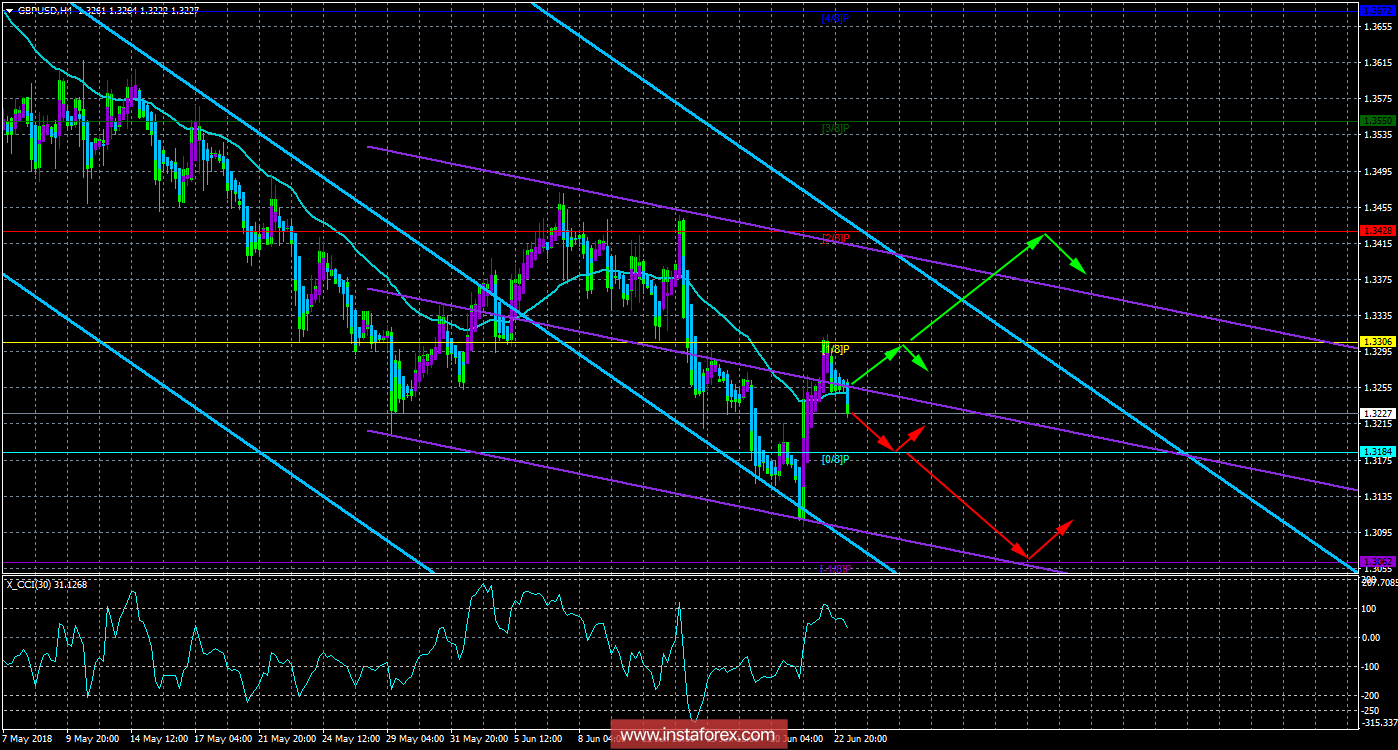
4-hour timeframe

Technical data:
The senior channel of linear regression: direction - down.
The younger channel of linear regression: direction - down.
Moving average (20; flattened) - sideways.
CCI: 31.1268
The currency pair GBP / USD was fixed above the moving average line, however, it is impossible to develop the upward movement of traders. In the next few hours, the price may return below the moving average, which will return the instrument to a downward trend, which is supported by two linear regression channels, directed downwards. The last bars indicator Heiken Ashi colored blue, which initially indicated a correction, now points to a very likely resumption of the downtrend after a two-day break. The calendar of macroeconomic events on Monday, June 25, is completely empty, but at the beginning of the European trading session it is already clear that traders are not going to sit out "in the bushes." The absence of surmounting the level of Murray "1/8" also indirectly indicates the resumption of the downward movement.
Nearest support levels:
S1 - 1.3184
S2 - 1.3062
S3 - 1.2939
Nearest resistance levels:
R1 = 1.3306
R2 = 1.3428
R3 = 1.3550
Trading recommendations:
The pair GBP / USD may finish moving upwards, level 1,3306 has been fulfilled. It is recommended to open new purchases only after fixing the price above the level of 1.3306, which will show the intention of bulls to resume the formation of a short-term uptrend with a target of 1.3428.
Shorts are recommended to consider in case of fixing the price below the removals. In this case, the initiative on the instrument will again fall into the hands of the bears, and the target for the downward movement will be 1.3184.
In addition to the technical picture, one should also take into account the fundamental data and the time of their release.
Explanations for illustrations:
The upper channel of linear regression is the blue lines of unidirectional motion.
The junior channel is linear-violet lines of unidirectional motion.
CCI - the blue line in the regression window of the indicator.
Moving average (20; smoothed) - the blue line on the price chart.
Levels of Murray - multi-colored horizontal stripes.
Heiken Ashi is an indicator that color bars in blue or purple.


