


GBP / USD
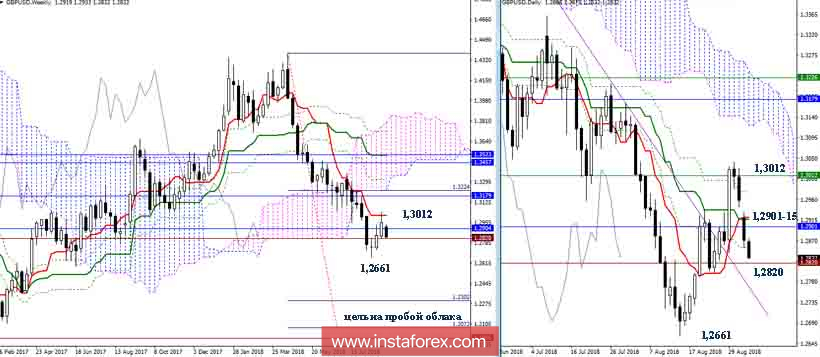
The pair failed to reliably overcome the consolidation of the support of the monthly Fibo Kijun (1.2904) and the historical level (1.2820). The braking in this area provoked an upward correction to the weekly Tenkan (1.3012) and now, the pound continues to remain in the zone of attraction of the supported supports. Recovering the downtrend (the minimum extremum of 1.2661) will allow considering the possibility of executing a downward target on the breakdown of a weekly cloud (1.2302 - 1.2072). The long-term presence in the zone of correction and attraction of levels can lead to the continuation of corrective lifting. The following upward guidance, in this case, can be noted in the areas of 1.3179 - 1.3225 (day cloud + weekly Senkou Span B + monthly Kijun) and 1.3457 - 1.3523.
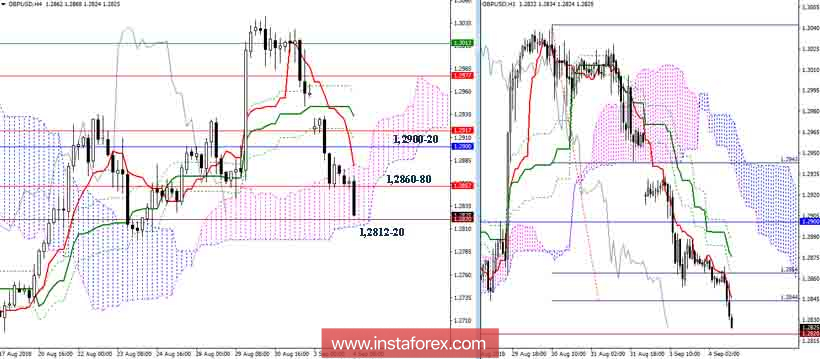
The support for the target for the breakdown of the H1 cloud has been left behind. The main interest now is the lower boundary of the cloud H4 (1.2812), reinforced by the historical level (1.2820). The formation of a breakdown at this site will form a downside target for the breakdown of the H4 cloud. Among the resistance today, we can note the most significant zones of 1.2860-80 and 1.2900-20. The strengthening above will change the current balance of power and will require a new assessment of the situation.
Indicator parameters:
All time intervals 9 - 26 - 52
The color of indicator lines:
Tenkan (short-term trend) - red,
Kijun (medium-term trend) - green,
Fibo Kijun is a green dotted line,
Chinkou is gray,
Clouds: Senkou Span B (SSB, long-term trend) - blue,
Senkou Span A (SSA) - pink.
The color of additional lines:
Support and resistance MN - blue, W1 - green, D1 - red, H4 - pink, H1 - gray,
Horizontal levels (not Ichimoku) - brown,
Trend lines - purple.


