


To open long positions on GBP/USD you need:
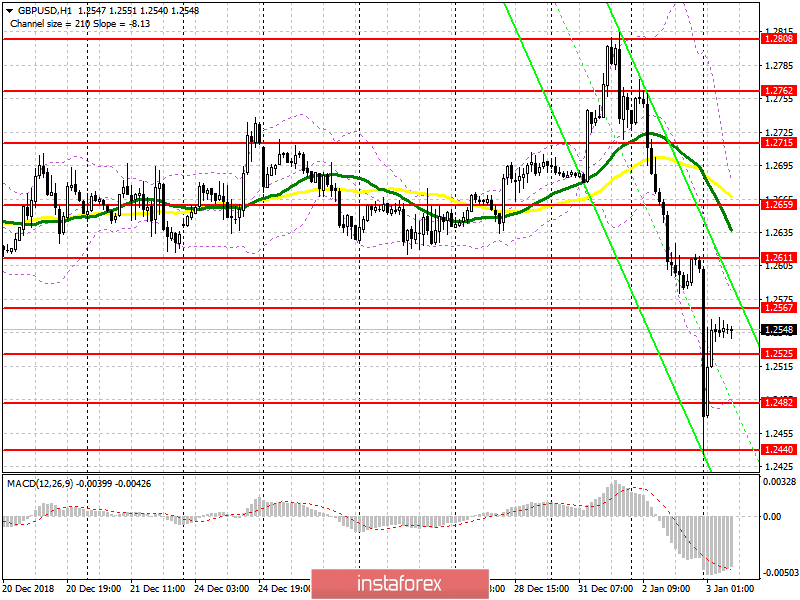
The British pound has fallen by more than 1.5% today in the Asian session, as the probability of concluding an agreement on Brexit is moving further and further away. It is best to consider buying the pound in the current environment after the update of today's lows in the area of major support levels of 1.2482 and 1.2440. The main task of buyers will be the return and consolidation above the resistance of 1.2567, which will lead to the continuation of the upward correction in the area of resistance at 1.2611, where I recommend to take profits.
To open short positions on GBP/USD you need:
Sellers urgently need to return to the support level of 1.2525, which will lead to a new wave of sales of GBP/USD with a test of lows of 1.2482 and 1.2440, where I recommend taking profits. A failure to consolidate above the resistance of 1.2567 on the data on the UK construction sector will also be a signal to sell the pound to the daily lows. In a different scenario, short positions can be opened to rebound from 1.2611.
Indicator signals:
Moving averages
Trade is conducted below the 30-day and 50-day daily moving averages, which indicates that pressure on the pound remains.
Bollinger bands
In the event of a decrease in the pound, support will be provided by the lower limit of the Bollinger Bands indicator around 1.2490, from which you can open low positions. The upward trend may be limited by the average border of the indicator 1.2575, as well as its upper boundary in the area of 1.2659, from which pound sellers will return to the market.
Description of indicators
- MA (moving average) 50 days - yellow
- MA (moving average) 30 days - green
- MACD: fast EMA 12, slow EMA 26, SMA 9
- Bollinger Bands 20


