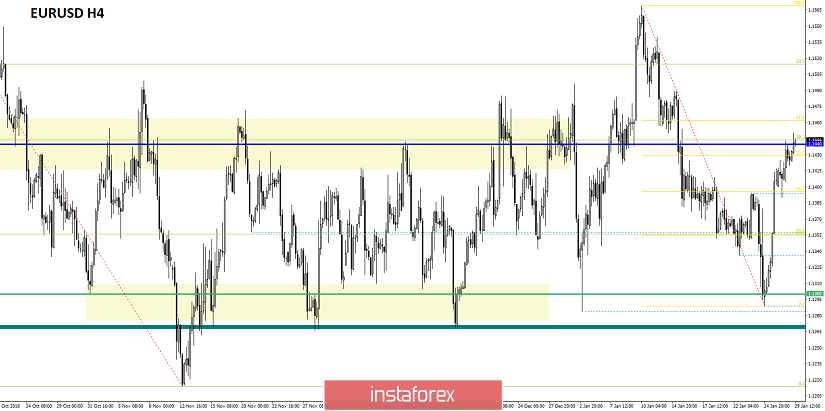
The currency pair Euro / Dollar for the last trading day showed low volatility, but still maintaining an upward mood. From the point of view of technical analysis, we see how the quote reached the range level of 1.1440 (1.1420 / 1.1460), where it slowed down. Informational and news background had a speech by Mario Draghi, which was traditionally held in pessimistic colors, but since he said almost everything the same as at the ECB meeting, the market practically did not react to it. Now the focus is on voting in the British Parliament, where there is a question of approving or disapproving the new plan of the Theresa May Agreement. Many experts are inclined to believe that Theresa May's plan will fail again, although she has already made it clear that she is ready to support the amendment proposed by her fellow party conservative Graeme Brady, which essentially proposes to reformulate an article on "backstop" for Northern Ireland, in order for Brussels to propose additional measures that could convince the most uncompromising supporters of Brexit. Major players, in turn, take a waiting position.

Further development
Analyzing the current trading chart, we see how the quote is trying to fix above the level of 1.1440, but still being inside its framework of 1.1420 / 1.1460. It is likely to assume a bumpkin inside the level where you can make a banner from trading orders. In turn, large investors recommend waiting out the information background in order not to run into false wagging in case of high volatility. Speculators are waiting for this very volatility to make money on short-term price jumps.

Based on the available data, it is possible to decompose a number of variations, let's consider them:
- We consider buying positions in case of price fixing higher than 1.1460.
- We consider selling positions in case of price fixing lower than 1.1410.
Indicator Analysis
Analyzing a different sector of timeframes (TF ), we see that in the short and intraday perspective there is an upward interest against the background of the upward trend. The medium-term perspective for a long time changed interest fro descending to neutral.
Weekly volatility / Measurement of volatility: Month; Quarter; Year
Measurement of volatility reflects the average daily fluctuation , with the calculation for the Month / Quarter / Year.
(January 29 was based on the time of publication of the article)
The current time volatility is 30 points. It is likely to assume that due to the background information, the volatility of the current day will exceed the average daily value, in the case of abrupt actions or emotions from England.
Key levels
Zones of resistance: 1.1440; 1.1550; 1.1650 *; 1.1720 **; 1.1850 **; 1.2100
Support areas: 1.1350 *; 1,1300 **; 1.1214 **; 1.1120; 1.1000
* Periodic level
** Range Level


