


By the end of the trading week, the pound/dollar currency pair showed low volatility of 96 points. As a result, it had an amplitude between two levels. From the point of view of technical analysis, we certainly have a pullback, but because of the hype on Brexit, there is still a lot of speculative interest, which keeps the quote from a full correction. Development in recent days has evolved in the form of ambiguous doji-type candles, where as a result compression has come within the boundaries of 1.3200 / 1.3300. Information and news background continues to delight participants of the market with bursts of the British "Kingdom". Theresa May is unintentionally lost and thus, she no longer knows how to scare parliament into voting for its proposed agreement. This time, the threat carries a message if the Euro-skeptics in its Conservative Party do not promise to vote for an agreement this week, May might abandon the attempt to hold Brexit soon. What can I say is that the circus left. The clowns remained, but we will still continue to observe.
Today, in terms of the economic calendar, nothing is expected to come out. Therefore, by the middle of the week, we are waiting for a wide stream of news and meetings, and, as always, we will keep on monitoring the information background.
Further development
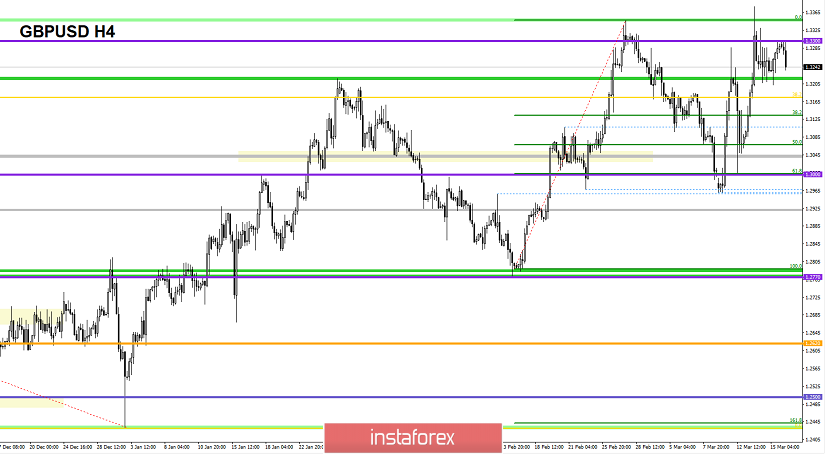
Analyzing the current trading schedule, we continue to observe the amplitude movement of 1,3200 / 1,3300. At the moment, we are continuously working it out at the upper limit. Probably, the assumption lies on the preservation of the current movement, while consistently working out the boundaries. In turn, there are two fronts: the first ones are trying to work within a range with a smaller trading volume, others are waiting for clear breakdowns of the existing borders.
Based on the available data, it is possible to decompose a number of variations, let's consider them:
- Consider buy positions in the case of a lower limit of 1.3220, with a smaller volume, or we will have wait for a clear fixation higher than 1.3300.
- Positions for sale, which were already considered, have already gone after working off the upper limit of 1.3300. Now they are waiting for convergence from 1.3220, another part of traders is waiting for a clear fixation lower than 1.3200.
Indicator Analysis
Analyzing a different sector of timeframes (TF ), we see that in the short term, there has been a downward interest while working out the upper limit. Intraday perspective changed interest to neutral, probably due to current uncertainty. The medium term has an upward interest.

Weekly volatility / Measurement of volatility: Month; Quarter; Year
Measurement of volatility reflects the average daily fluctuation , with the calculation for the Month / Quarter / Year.
(March 18, was based on the time of publication of the article)
The current time volatility is 64 points. . If the quote remains within the amplitude, then the volatility will remain low.

Key levels
Zones of resistance: 1.3300 **; 1.3440; 1.3580 *; 1.3700
Support areas: 1,3200 *; 1.3130 *; 1.3000 ** (1.3000 / 1.3050); 1.2920 *; 1.2770 (1.2720 / 1.2770) **; 1.2620; 1.2500 *; 1.2350 **.
* Periodic level
** Range Level


