


EUR/USD
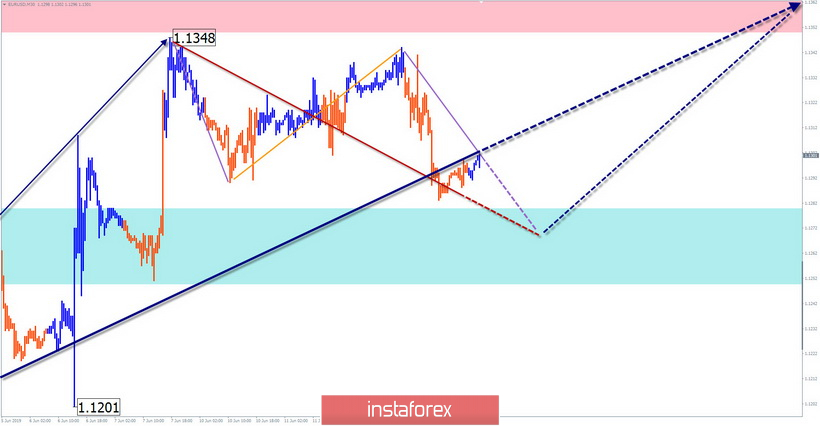
For the analysis of the upcoming picture on the day in the euro market, the most interesting is the last rising wave of May 23. The wave has a fairly high wave level, allowing you to expect it to continue in the coming weeks. Since June 7, the price is adjusted down.
Forecast:
Today in the first half of the day, a flat mood movement with a downward vector is expected. The end of the bearish wave of the last days is most likely in the area of estimated support. The change of direction can be expected at the end of the day.
Recommendations:
When selling the euro, one should take into account the small potential of the move down and the likelihood of sharp price rebounds. In the support area, it is recommended to track reversal signals to search for entry points to long positions on this instrument.
Resistance zone:
- 1.1350/1.1380
Support zone:
- 1.1280/1.1250
GBP/USD
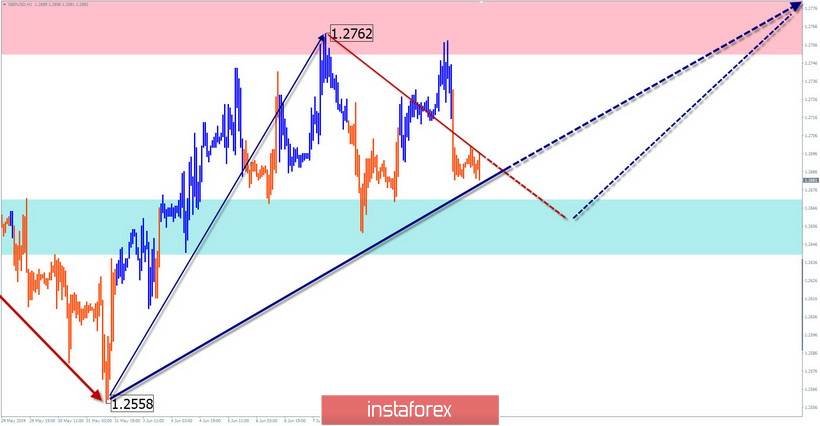
On the chart of the pound, the bullish wave from May 31 corrects the last section of the main trend from May 3. Analysis of the structure shows its incompleteness. The preliminary target zone is located above the current level by about one and a half price figures. Since June 7, a correction in the form of a standard plane is formed.
Forecast:
At the next session, the price decline is expected, until its full completion in the support area. Next, the major pound is waiting for a turn and the beginning of the rate rise. When the intersessional trend is reversed, a pair is likely to increase in volatility.
Recommendations:
The sale of the pound today is not very promising. It is more reasonable to reduce the lot size. When the price reaches the boundaries of the settlement support, it is recommended to monitor the signals of buying the pair.
Resistance zone:
- 1.2750/1.2780
Support zone:
- 1.2670/1.2640
AUD/USD
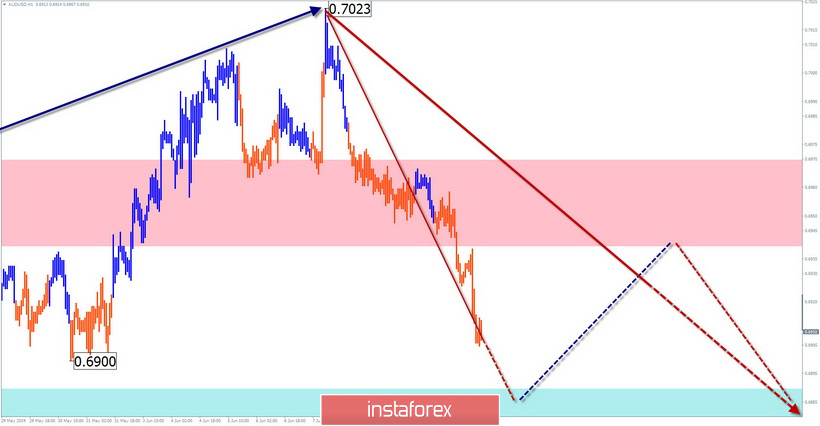
The direction of the main trend on the Australian dollar chart is set by a bearish wave. In its structure, the first 2 parts (A + B) have now been worked out. On June 7, the final part began (C). Quotes are approaching a strong support zone.
Forecast:
Today, we expect the completion of the current decrease and the beginning of the counter-correction of the pair. With high probability, it will be "sideways", possibly with an upward vector. The resistance zone shows the maximum possible level of the upcoming rollback up.
Recommendations:
In the near future, trading on the market of the pair can only be within the trading sessions, at the smallest TF. Sales have a small potential for a move. When buying, it is necessary to take into account the probability of sharp counter-rollbacks. The most reasonable tactic is to refrain from trading and wait for the opportunity to sell the pair at the end of the upcoming correction.
Resistance zone:
- 0.6940/0.6970
Support zone:
- 0.6890/0.6860
Explanations to the figures: Waves in the simplified wave analysis consist of 3 parts (A-B-C). The last unfinished wave is analyzed. Zones show areas with the highest probability of reversal. The arrows indicate the wave marking according to the method used by the author, the solid background is the formed structure, the dotted ones are the expected movements.
Attention: Wave algorithm does not take into account the duration of tool movements over time.


