


4-hour timeframe
Technical data:
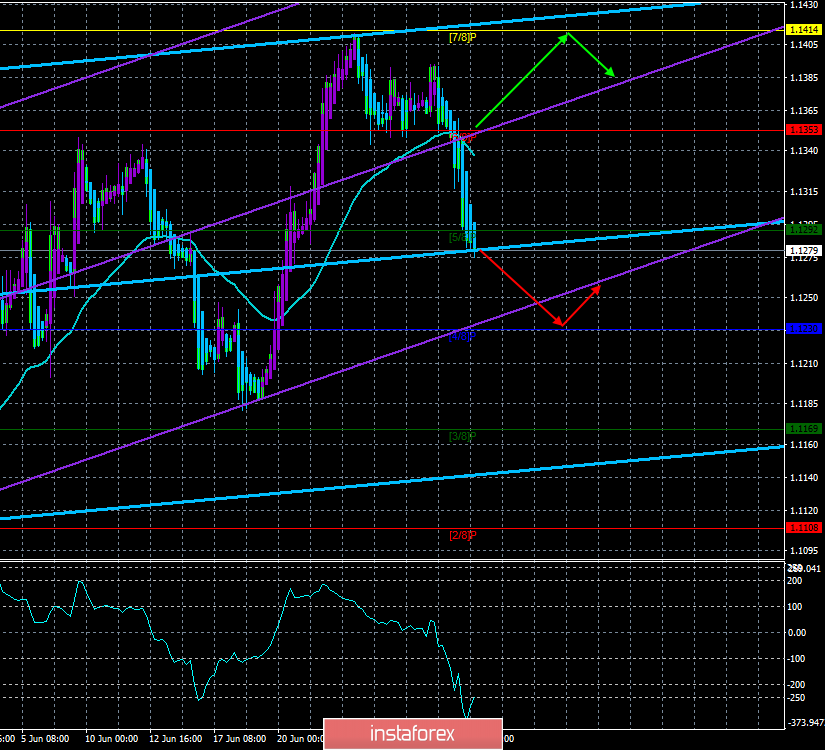
The upper linear regression channel: direction – up.
The lower linear regression channel: direction – up.
The moving average (20; smoothed) – down.
CCI: -247.7164
The first trading day of the week was awful for EUR/USD. Business activity indices for June in Europe and the US showed an improvement in the situation in the States and a deterioration in the EU. Thus, traders received the necessary basis for new purchases of the US currency. Moreover, according to many media reports, Trump and Xi Jinping agreed on a trade agreement at the G20 summit, so there are hopes for the end of the trade war between China and America in the coming months. All this brings the Fed closer to the fact that the country's economic indicators will cease to slow down and worsen, and the key rate will not have to be reduced. And this, in turn, will save traders from having to sell dollars. And the only person who will not be frankly satisfied with this option is Donald Trump, who will most likely continue to pressure Jerome Powell. Thus, we can assume that their confrontation will continue. On Tuesday, July 2, no important macroeconomic publications are planned. Thus, today is a good day to start the upward correction round, as the CCI indicator is heavily oversold. The main question now is whether the strengthening of the US dollar is short-term or the foreign exchange market has returned to long-term "dollar" positions?
Nearest support levels:
S1 – 1.1230
S2 – 1.1169
S3 – 1.1108
Nearest resistance levels:
R1 – 1.1292
R2 – 1.1353
R3 – 1.1414
Trading recommendations:
The EUR/USD pair has overcome the moving, thus, the trend has changed to downward. Now, it is recommended to trade short positions, supporting open short positions with the aim of Murray's level of "4/8" - 1.1230.
It is recommended to buy the euro currency after traders consolidate back above the moving average line, which will change the trend to an upward one, with the first target of 1.1414.
In addition to the technical picture should also take into account the fundamental data and the time of their release.
Explanation of illustrations:
The upper linear regression channel – the blue line of the unidirectional movement.
The lower linear regression channel – the purple line of the unidirectional movement.
CCI – the blue line in the indicator window.
The moving average (20; smoothed) is the blue line on the price chart.
Murray levels – multi-colored horizontal stripes.
Heiken Ashi is an indicator that colors bars in blue or purple.


