


To open long positions on EURUSD, you need:
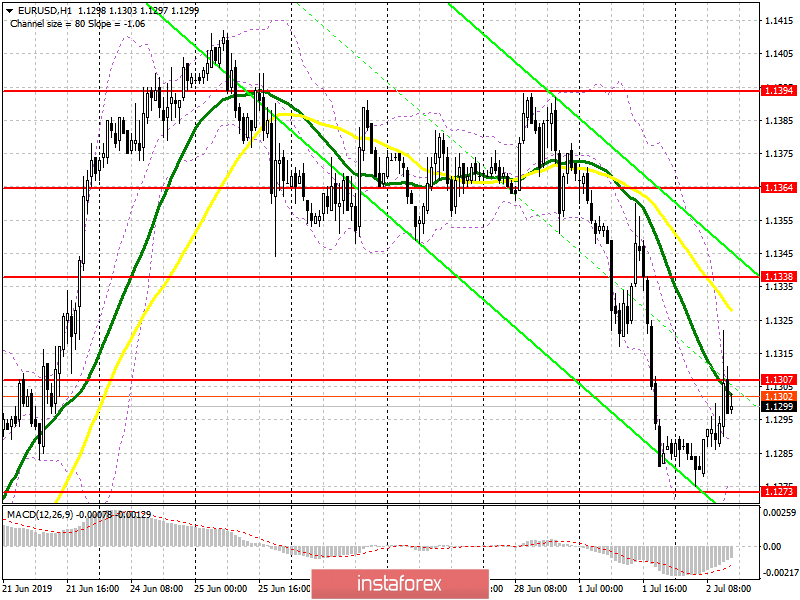
A weak inflation report on producer prices, which fell, once again allowed euro buyers to form only a small upward correction, which was limited by the resistance of 1.1307. At the moment, the task of the bulls remains the same. A break and consolidation above 1.1307 will lead to further growth of EUR/USD with an update of the maximum of 1.1338, where I recommend fixing the profit. If the downward movement continues, it is best to return to the long positions on a false breakout from the support of 1.1273 or on a rebound from the new monthly low around 1.1239.
To open short positions on EURUSD, you need:
Like yesterday, the bears will try to form a false breakout in the resistance area of 1.1307, and the return under it in the afternoon will be a signal for the continuation of the downward trend, which will push EUR/USD to the low area of 1.1273 and will lead to the renewal of a larger support of 1.1239. If the demand for the euro continues, the upward potential will be limited by the resistance of 1.1338, just above which the upper limit of the downward channel passes. With their breakthrough, you can sell immediately on the rebound from the maximum of 1.1364.
Indicator signals:
Moving Averages
Trading is conducted below 30 and 50 moving averages, and their test from the bottom up in the morning is a kind of signal to open short positions.
Bollinger Bands
The growth of EUR/USD is limited by the upper boundary of the indicator around 1.1310. A breakthrough in this area could lead to a larger euro growth in the afternoon.
Description of indicators
- MA (moving average) 50 days – yellow
- MA (moving average) 30 days – green
- MACD: fast EMA 12, slow EMA 26, SMA 9
- Bollinger Bands 20


