


4-hour timeframe
Technical data:
The upper channel of linear regression: direction – up.
The lower channel of linear regression: direction – up.
The moving average (20; smoothed) – down.
CCI: -106.3278
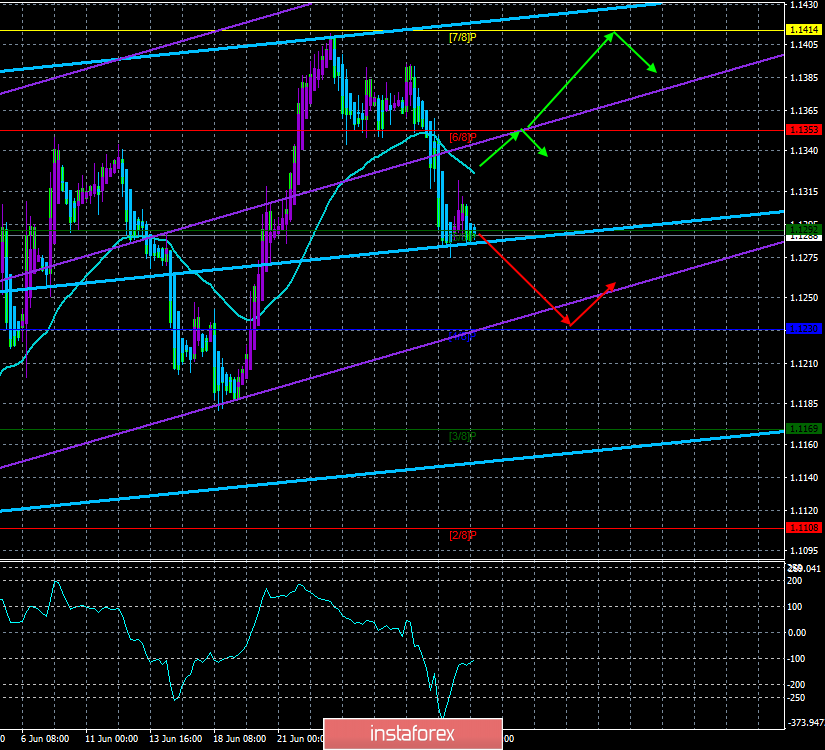
On Wednesday, July 3, the EUR/USD pair is trying to resume the downward movement, after a slight upward correction, as evidenced by the blue bars of the Heiken Ashi indicator. Today, the euro will have every chance of continuing to fall against the US dollar, as macroeconomic publications today will be enough. First, the indices of business activity in the services sector and production (composite) of the eurozone and the United States. Second, it is a report from the ADP on changes in employment in the private sector. Recall that this week, business activity in the EU manufacturing sector has already failed, and in the US - on the contrary, exceeded its forecasts. Since just yesterday, it was reported that the ECB at the next meeting may announce a reduction in the key rate, the worse the statistics from the EU, the faster it will happen. We draw traders' attention to how quickly the fundamental background for the euro/dollar is changing. Two weeks ago, the markets were discussing the weak statistics from the US and the possible Fed rate cut. Now, we are talking about reducing the ECB rate, which in this case will be negative, while in the States, the rate will remain positive. Thus, the US dollar will still have the advantage.
Nearest support levels:
S1 – 1.1230
S2 – 1.1169
S3 – 1.1108
Nearest resistance levels:
R1 – 1.1292
R2 – 1.1353
R3 – 1.1414
Trading recommendations:
The EUR/USD currency pair resumed its downward movement. Now, therefore, it is recommended to trade short positions with the target level of Murray "4/8" - 1.1230 to a new reversal of the Heiken Ashi to the top.
It is recommended to buy the euro currency after traders consolidate back above the moving average line, which will change the trend to an upward one, with the first target of 1.1414.
In addition to the technical picture should also take into account the fundamental data and the time of their release.
Explanation of illustrations:
The upper linear regression channel – the blue line of the unidirectional movement.
The lower linear regression channel – the purple line of the unidirectional movement.
CCI – the blue line in the indicator window.
The moving average (20; smoothed) is the blue line on the price chart.
Murray levels – multi-colored horizontal stripes.
Heiken Ashi is an indicator that colors bars in blue or purple.


