


4-hour timeframe
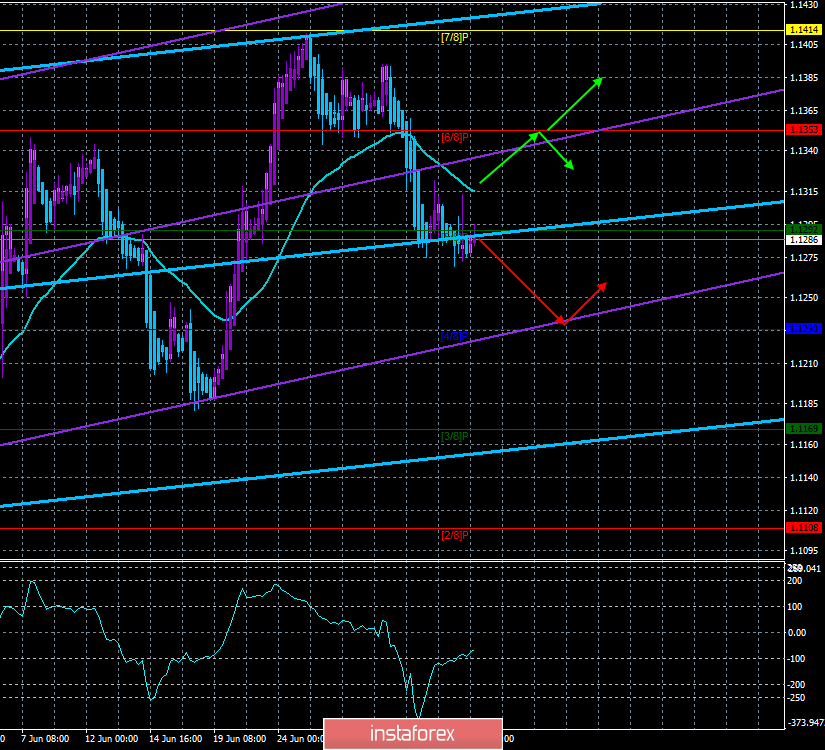
Technical data:
The upper channel of linear regression: direction – up.
The lower channel of linear regression: direction – up.
The moving average (20; smoothed) – down.
CCI: -67.0441
On Thursday, July 4, the EUR/USD pair continues a calm downward movement. Yesterday, although it was a bit controversial for the EU currency in terms of macroeconomic data, it ended with a decline in the euro. Despite the fact that 2-3 weeks ago, many experts were discussing the completion of the global dollar trend, we wrote back then that a few weeks of weak statistics from overseas do not mean the end of the hegemony of the US currency in the forex market. Now, despite the consolidation of the euro/dollar pair below the moving average line, the decline can still be called a correction, just deep. However, every day and every 20-30 points, passed down, the chances of resuming the upward trend are reduced. Today, no important macroeconomic information from the US will be received, as the country will celebrate Independence Day. US markets will be closed, which may result in a decrease in volatility on Forex. From the European Union today, information about the change in the volume of retail trade in May will be released. An increase of 1.5% is expected, although it is not so important and strong report to cause a serious strengthening of the euro, even if the real value exceeds the forecast.
Nearest support levels:
S1 – 1.1230
S2 – 1.1169
S3 – 1.1108
Nearest resistance levels:
R1 – 1.1292
R2 – 1.1353
R3 – 1.1414
Trading recommendations:
The EUR/USD currency pair continues its downward movement. Now, it is recommended to continue to trade on the decline to the level of Murray "4/8" - 1.1230 to the reversal of the indicator Heiken Ashi up.
It is recommended to buy the euro currency after traders consolidate back above the moving average line, which will change the trend to an upward one, with the first target of 1.1353.
In addition to the technical picture should also take into account the fundamental data and the time of their release.
Explanation of illustrations:
The upper linear regression channel – the blue line of the unidirectional movement.
The lower linear regression channel – the purple line of the unidirectional movement.
CCI – the blue line in the indicator window.
The moving average (20; smoothed) is the blue line on the price chart.
Murray levels – multi-colored horizontal stripes.
Heiken Ashi is an indicator that colors bars in blue or purple.


