


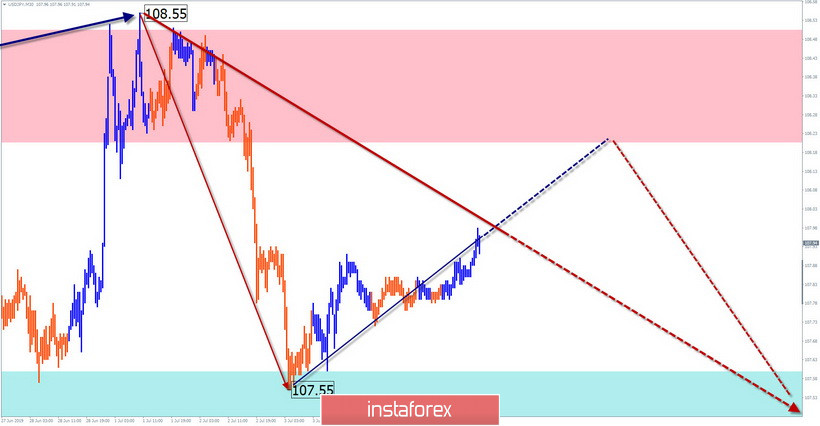
USD / JPY pair
In the main bearish wave of the trend on July 1, the bullish correction ended. From this time on, a reversal pattern is formed on the graph, preceding the beginning of a new section of the main trend. In recent days, the pair has been developing upward on the market.
Forecast:
The upward ascending mood is expected to continue today. In the afternoon, the likelihood of a reversal and price reduction has increased.
Recommendations:
The current price rise of the yen is more reasonable to ignore. Increased volatility and of course, a change are most likely during the release of news blocks from the United States. It is recommended to track the signals of your indicators to sell the instrument.
Resistance zones:
- 108.20 / 108.50
Support areas:
- 107.60 / 107.30
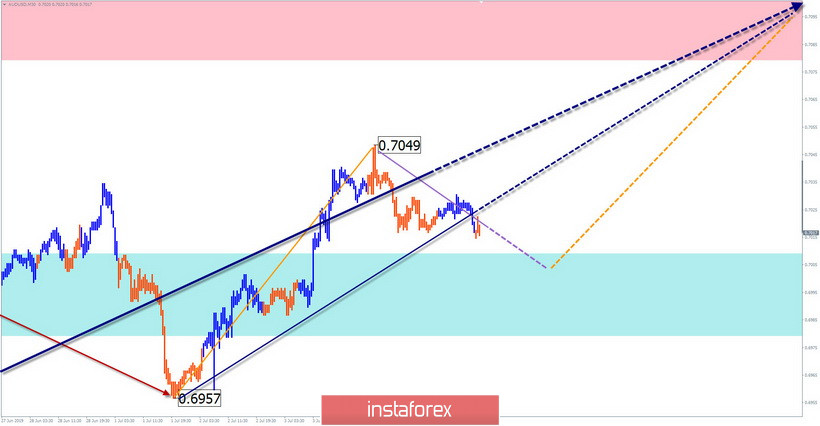
AUD / USD pair
The main direction in the short-term scale of the "Australian" is linked to the algorithm of the rising wave of May 21 at the end of the dominant bearish trend and so far does not go beyond its correction. There is a clear zigzag in the wave structure and it lacks the final section. Since yesterday, the price rolls back down.
Forecast:
Today, the decline of the pair beginning yesterday is expected to get completed. A breakthrough of the lower boundary of the support zone is unlikely but of course, a change is most likely at the American trading session. Before that, a sharp increase in volatility is possible.
Recommendations:
Aussie sales are unpromising today. It is recommended to focus on the emerging signals to purchase the instrument. The target area is the resistance zone.
Resistance zones:
- 0.7080 / 0.7110
Support areas:
- 0.7010 / 0.6980
Explanations to the figures: The simplified wave analysis uses waves consisting of 3 parts (A – B – C). Each of these analyzes the last incomplete wave. Zones show calculated areas with the highest probability of reversal. The arrows indicate the wave marking by the method used by the author. The solid background shows the formed structure and the dotted exhibits the expected movement.
Note: The wave algorithm does not take into account the duration of tool movements over time.


