


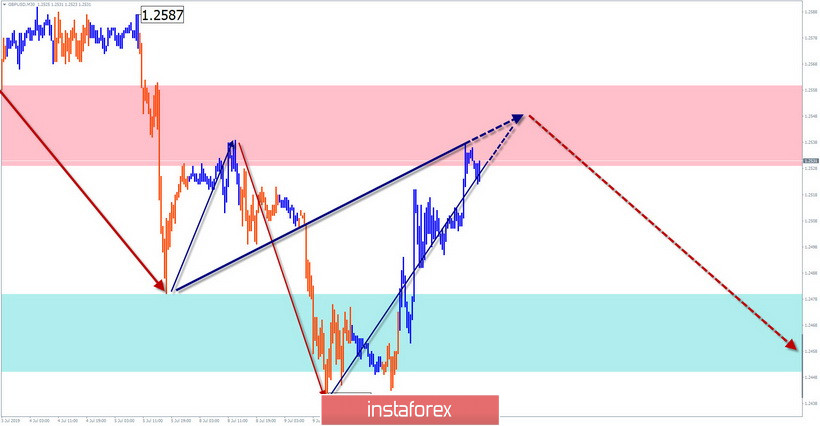
GBP/USD
On the chart of the British currency, a bearish wave is developing since June 25, which sets the main rate of the major pair. In its framework, since July 5, a counter-correction wave is formed, which has the wrong form. The structure at the time of analysis looks complete. Since yesterday, a counter movement with a reversal potential has been formed at the end of the correction.
Forecast:
For today, the expected completion of the upward movement, the reversal formation and the beginning of a decline. The lower limit of the expected daily range shows the support zone.
Recommendations:
In the first half of the day, the pair will be unpromising. It is recommended to refrain from trading until there are clear signals of the change of the main course. When selling, it is reasonable to reduce the lot to a minimum.
Resistance zone:
- 1.2530/1.2560
Support zone:
- 1.2480/1.2450
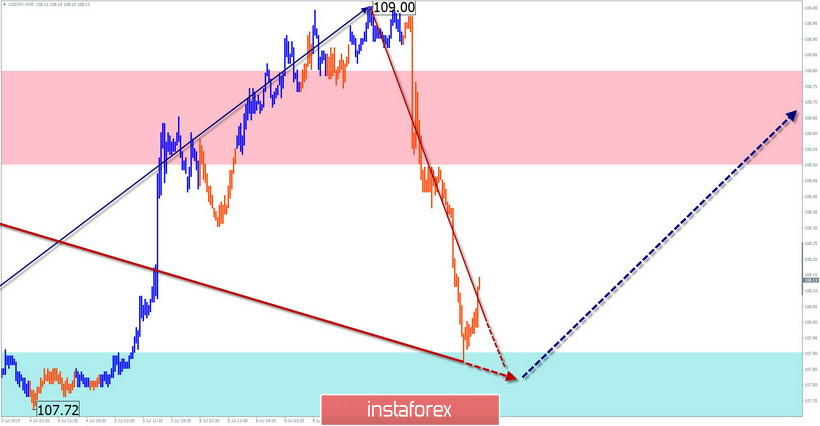
USD/JPY
On the chart of the Japanese yen, the bullish wave of June 21 remains unfinished. In its structure, on July 7, a downward wave began to form, which does not go beyond the correction (B). The final part of this zigzag worked yesterday. At the time of analysis, the correction structure looks complete. Reversal signals are not yet observed on the chart.
Forecast:
The most likely scenario of the movement today will be the general flat rate of the pair, mainly with an upward vector. Short-term counter-rollbacks are not excluded. The resistance zone shows the upper limit of the expected daily range.
Recommendations:
Trading today is quite risky, it is possible only within the trading sessions. Before the appearance of clear signals of the exchange rate change when buying a pair, it is necessary to reduce the lot used and be ready to close the transaction at the first signs of a rollback.
Resistance zone:
- 108.50/108.80
Support zone:
- 107.90/107.60.
Explanations to the figures: Waves in the simplified wave analysis consist of 3 parts (A-B-C). The last unfinished wave is analyzed. Zones show areas with the highest probability of reversal. The arrows indicate the wave marking according to the method used by the author, the solid background is the formed structure, the dotted ones are the expected movements.
Note: The wave algorithm does not take into account the duration of tool movements over time.


