


GBP/USD
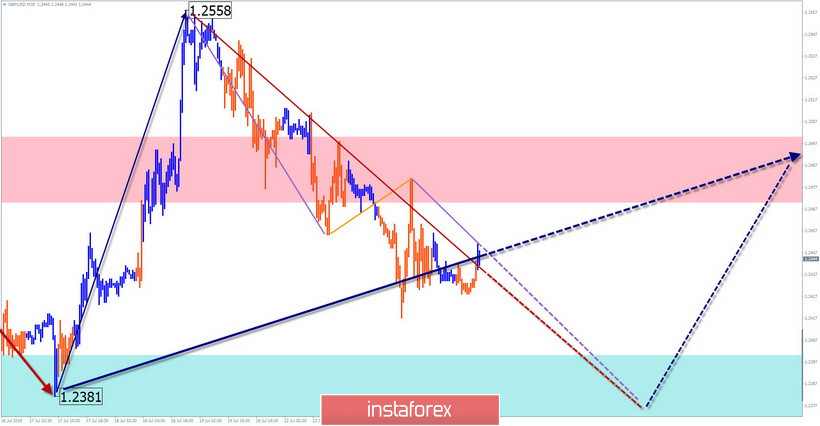
The upward wave of the pound, which began on July 17, has a reversal potential. After the formation of the counter correction, the upward movement will continue. Since the end of last week, the price forms a correction (B), which lacks the final section
Forecast:
Given the type of structure of the emerging model, as a result of the decrease, the probability of a puncture of the reference point of the entire wave is high. The next sessions are expected to complete the rollback, reversal, and continuation of the downward course of the movement.
Recommendations:
Buying the pound today can be risky. In the area of the calculated resistance, it is recommended to track the reversal signals to find the entry into short positions on this instrument.
Resistance zone:
- 1.2470/1.2500
Support zone:
- 1.2400/1.2370
USD/JPY
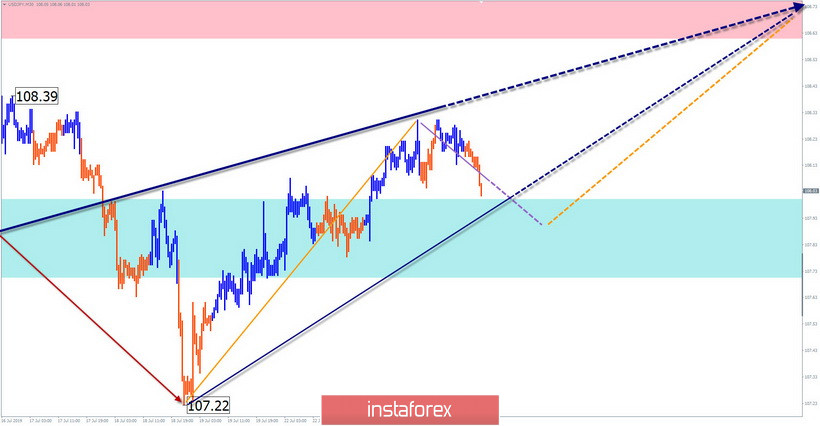
The direction of short-term fluctuations of the yen is set by the algorithm of the upward wave of June 21. The wave develops in the lateral plane. The structure completed the first 2 parts (A+B). Since July 18, the final part (C) has started, in which the rollback has been developing since yesterday.
Forecast:
Today, the current decline is expected to be completed, the exchange rate will change and the price will continue to rise. The most likely part of the turn is the support zone. The active phase of recovery is likely to shift to the next day.
Recommendations:
Yen sales today are unpromising. In the support area, it is recommended to monitor the signals of buying the pair.
Resistance zone:
- 108.60/108.90
Support zone:
- 108.00/107.70
Explanations to the figures: Waves in the simplified wave analysis consist of 3 parts (A-B-C). The last unfinished wave is analyzed. Zones show areas with the highest probability of reversal. The arrows indicate the wave marking according to the method used by the author, the solid background is the formed structure, the dotted ones are the expected movements.
Note: The wave algorithm does not take into account the duration of tool movements over time.


