


To open long positions on EURUSD, you need:
Weak data, particularly on the production index of Germany and eurozone pressured the euro. Indices remained below 50 points, indicating a decline in the sector. However, buyers, using the divergence on the MACD indicator, managed to keep the pair above the level of 1.1137, forming a new upward correction from it. At the moment, while trading is above this range, the main task of the bulls will be to break and consolidate above the resistance of 1.1160, which was not possible in the first half of the day. Weak fundamental data on the US economy can help. However, in case of a repeated decline in EUR/USD in the area of the minimum of 1.1137, its breakthrough may occur. In this scenario, it is best to consider new purchases of the euro from the new local support areas of 1.1110 and 1.1080.
To open short positions on EURUSD, you need:
Bears waited for the correction of the pair to the resistance area of 1.1160 and did not postpone sales to the "long box". As in the morning, their goal is the support of 1.1137, the repeated test of which can lead to its breakthrough, which will increase the pressure on the pair and cause further movement down to the area of the lows of 1.1110 and 1.1079, where I recommend taking the profits. In the afternoon, a number of reports on the index for the US service sector, as well as the PMI manufacturing sector. Good reports will put additional pressure on the weak euro and lead to the renewal of the next lows. If the data coincide with the forecasts of economists, it is unlikely that major players will make further attempts to sell EUR/USD before tomorrow's meeting of the European Central Bank. The optimal level for opening short positions, in the case of an upward correction, is the area of 1.1160 and a larger level of 1.1183.
Indicator signals:
Moving Averages
Trading is below 30 and 50 moving averages, which indicates the predominance of euro sellers in the market.
Bollinger Bands
In the case of an upward correction, the upper limit of the indicator in the area of 1.1160 will act as a resistance.
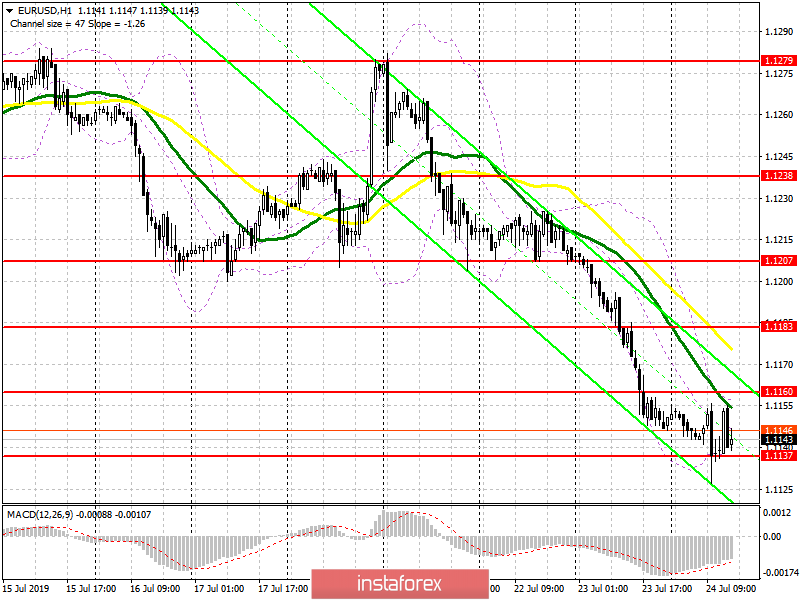
Description of indicators
- MA (moving average) 50 days – yellow
- MA (moving average) 30 days – green
- MACD: fast EMA 12, slow EMA 26, SMA 9
- Bollinger Bands 20


